
Is the weather the cause of poor water quality?
Key words: load; point source; non-point source; transport-limited; supply; nitrate
Note: A wide variety of animal and plant species can alter their surroundings in ways that are unfavorable to individuals of their own or other species. For the sake of simplicity, here I define pollution as chemical, biological, and physical adulteration of the environment related to human activities.
Many times here in Iowa we hear that weather is the cause of poor water quality in our lakes and streams, especially in discussions about stream nitrate. Is there merit to this idea? (If you are time-limited, short answer is no, but read on for details).
Stream water quality is a reflection of what is happening on the land area draining to the stream. Some pollutants are deliberately introduced to the stream network, usually through permitted, regulated and monitored point-source discharges like municipal wastewater treatment plants. We introduce other pollutants to the stream network unintentionally from sources widely dispersed across the landscape—non-point sources. Nitrate has both point and non-point source origins, although in Iowa more than 80% of our stream nitrate is from non-point sources.
It stands to reason that a non-point source pollutant can’t get from the land to the stream unless it rains enough to generate runoff though surface and/or subsurface pathways. This is why the total mass (load) of a water-soluble, non-point source pollutant delivered by a stream is usually transport-limited, i.e. the pollutant load correlates strongly with the volume of river discharge. And since river discharge is usually closely related to precipitation amount, by extension, loads relate to precipitation.
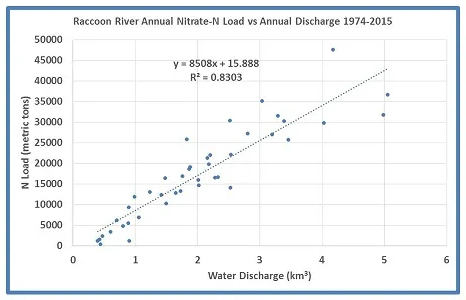
An example of transport limitation is shown in Figure 1. Each dot represents a year, with Raccoon River annual nitrate-nitrogen load plotted versus annual discharge. The r2 coefficient for this relationship is 0.83. Perfect correlation is 1.0. This basically means that discharge explains 83% of the load. If you tell me the discharge for any given year, without seeing nitrate water monitoring data, on average I can still tell you the nitrate load with an 83% accuracy. Pretty good!
But what about the other 17%–the portion not predicted by discharge? Does that mean we are responsible for only 17% of stream nitrate—NO! The remaining variability, the 17%, is a result of things happening on the landscape from year to year that vary the supply of nitrate that is vulnerable to loss. Over the past 150 years, our actions have greatly increased this supply. In Iowa, this increase has been about 6-10 times more than the pre-settlement levels. And when we increase the supply of a transport-limited pollutant, stream levels will increase accordingly–when it rains.
Returning to Figure 1, the r2 value may have been similar prior to European settlement. Why? Like today, the landscape then did not change much from year to year in terms of land cover and species diversity. Then too, weather would have been the main driver of year-to-year variability in nitrate loads. But would have the line in the graph looked the same? No. The slope (steepness) of the line and the magnitude of the nitrate loads would have been much lower in Iowa’s biologically-diverse native ecosystems.