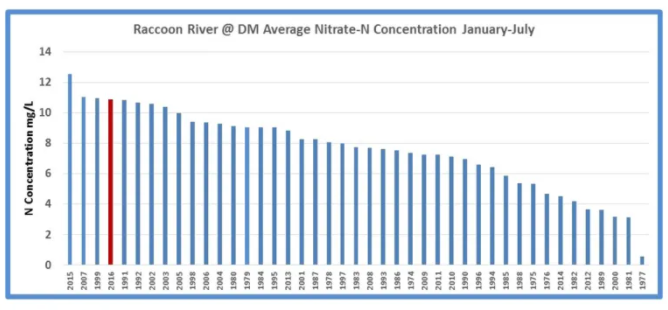
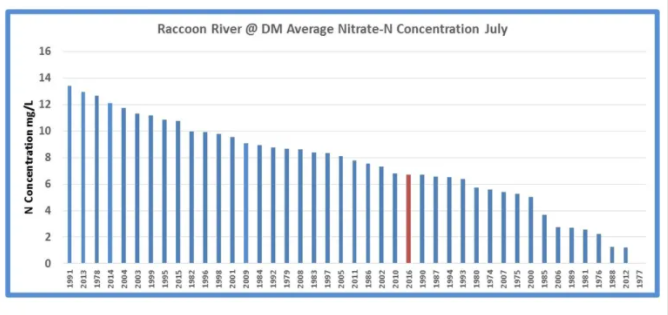
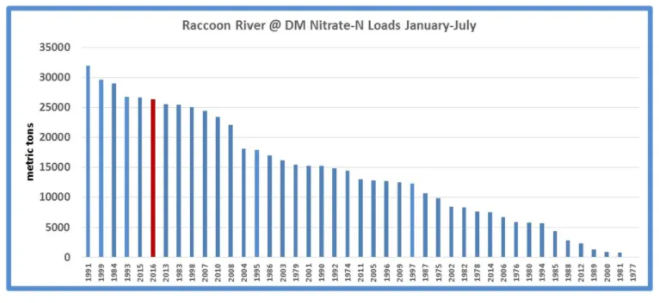
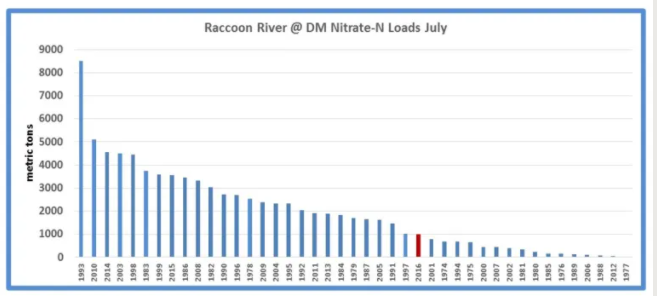
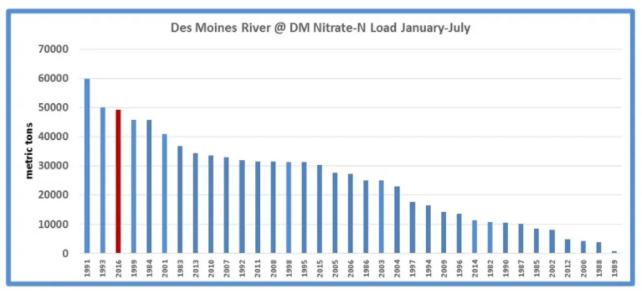
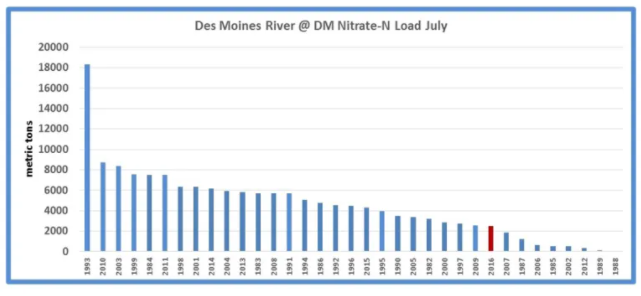
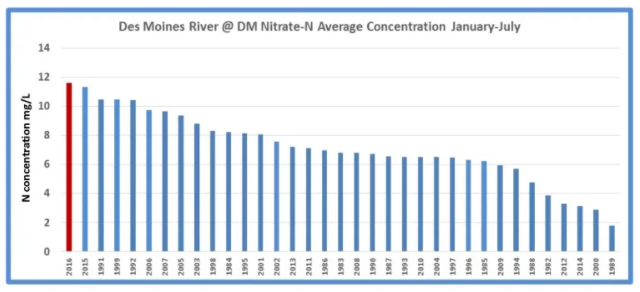
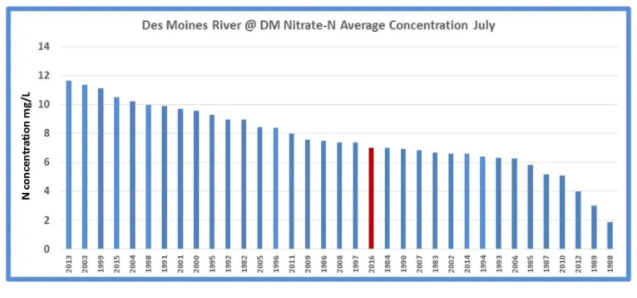
Over the years I have aggregated nitrate data for the Des Moines and Raccoon Rivers of central Iowa. Here is how July and and the January through July period for 2016 compares to other years. The period of record for the Raccoon is 1974-present. Period of record for the Des Moines is 1982-present. Concentration data is primarily from the Des Moines Water Works record, although some data gaps have been filled with data from the Des Moines River Water Quality Network. Loads were calculated using USGS discharge data (Des Moines River at 2nd Avenue; Raccoon is Van Meter + Walnut Creek).
Concentration is the amount of nitrate per unit volume of water, i.e. milligrams per liter (mg/L) which is the same as parts per million (ppm). The drinking water standard is 10 mg/L.
Load is the total mass of nitrate transported by the river. Units are metric tons. One metric ton is 1000 kilograms, which is about 2200 pounds.
Both concentration and load are calculated “as nitrogen” (as N), which is the protocol in the U.S.