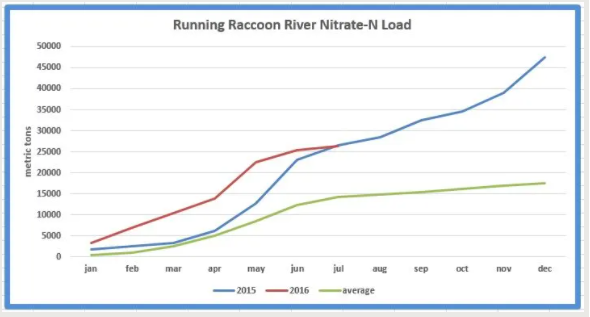
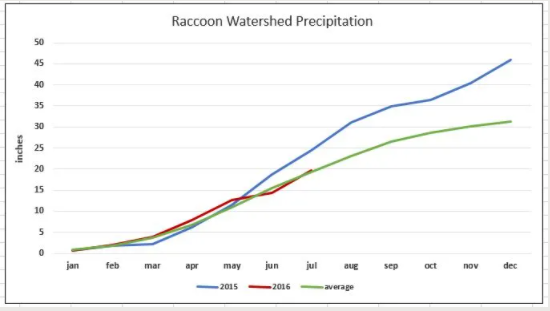
I updated some data yesterday and made a couple of simple graphs that might be of interest. These show how precipitation and nitrate load accumulate through the calendar year in the Raccoon Watershed. I included 2015, 2016, and an average year. Precipitation is calculated as an average of Des Moines, Guthrie Center, Storm Lake, and Rockwell City. Nitrate loads are at Des Moines.
Last year (2015) was the largest nitrate loading year ever on the Raccoon (1974-present), while annual precipitation was third highest (1893-present). Precipitation in the second half of the year was 27 inches, 59% of the total. On average, watershed precipitation is split almost exactly 50:50 into the first six months and last six months, and this distribution is not changing with time.
The graph on the left illustrates nitrate load (as nitrogen); on the right, precipitation. Both graphs show a running accumulation as the year progresses. There’s no doubt that second half precipitation in 2015 was driving first half nitrate load in 2016. Record rainfall in December 2015 was an especially strong driver of early 2016 nitrate loads. This combined with a warm winter, which kept the ground unfrozen and drainage tiles running, to make conditions favorable for nitrate delivery to the stream network. Now we have reached August, the effects 2015 wetness have declined or disappeared, and nitrate loading is returning to more normal levels.