Tuesday, September 13, 2016

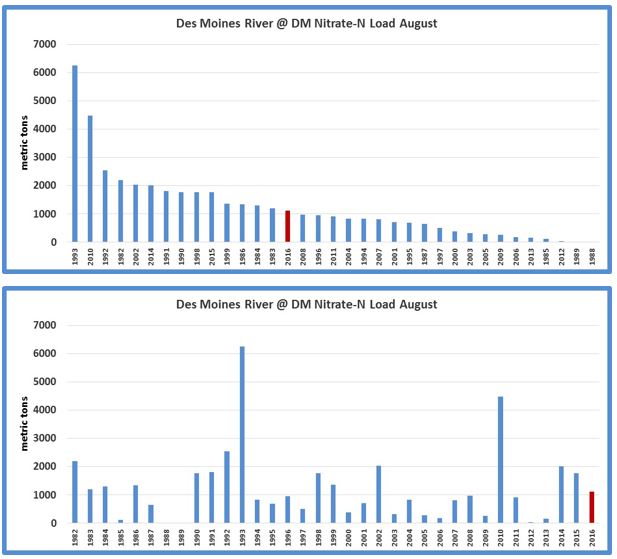
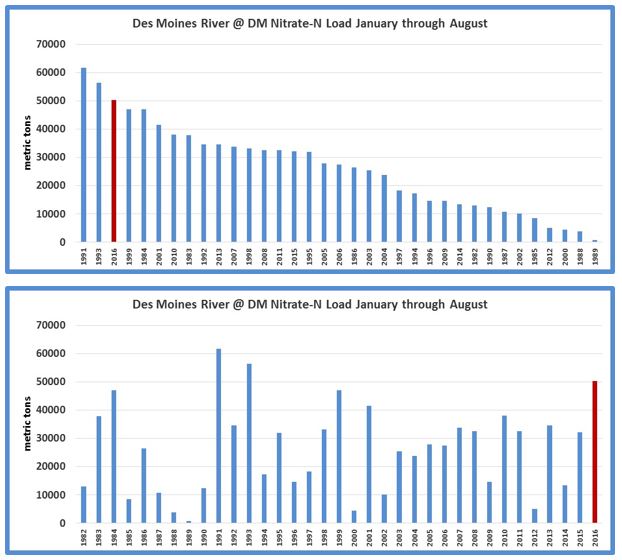
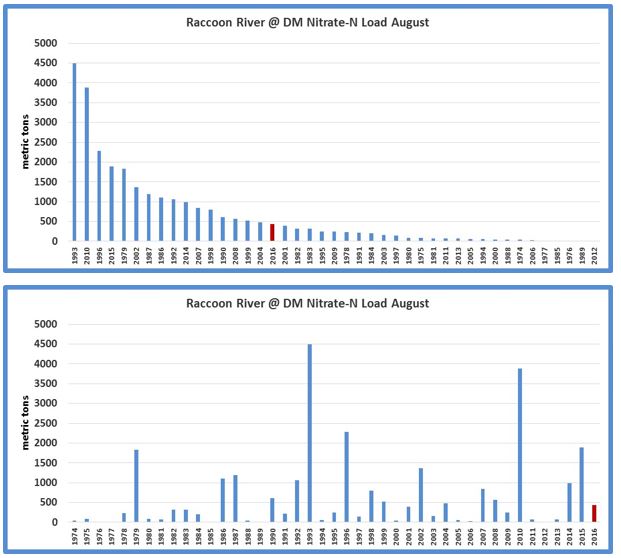
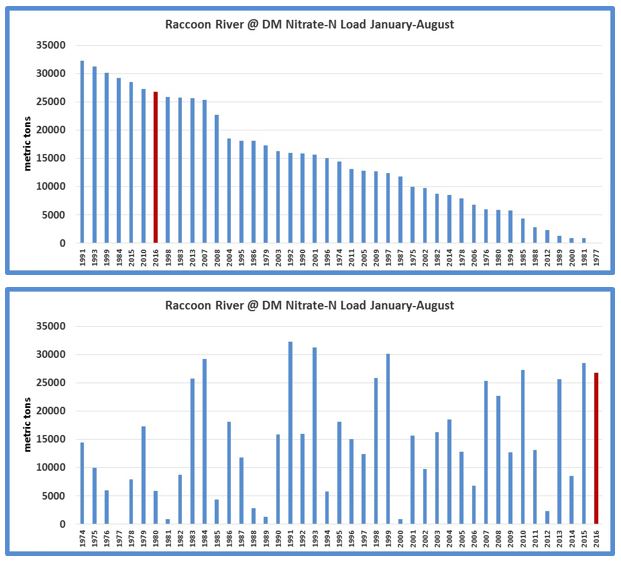
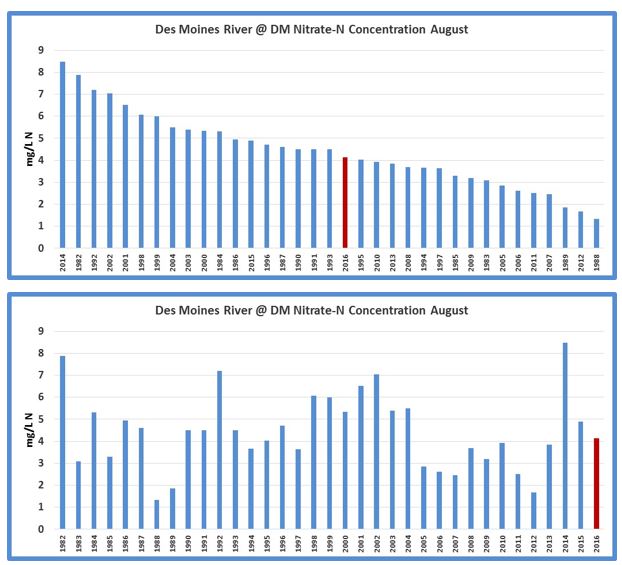
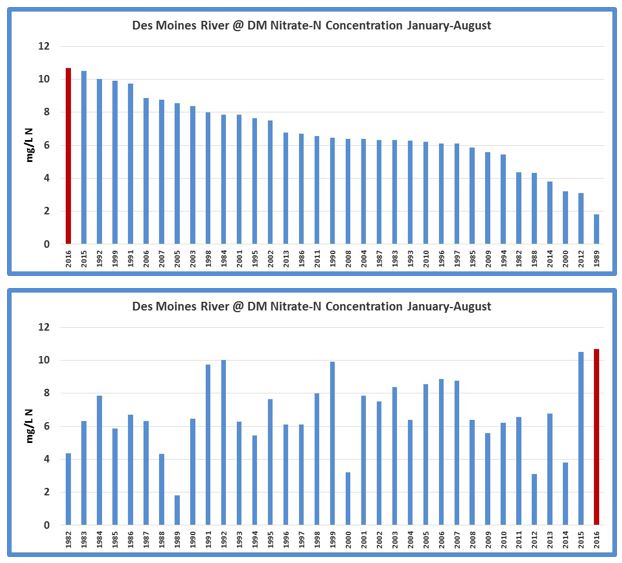
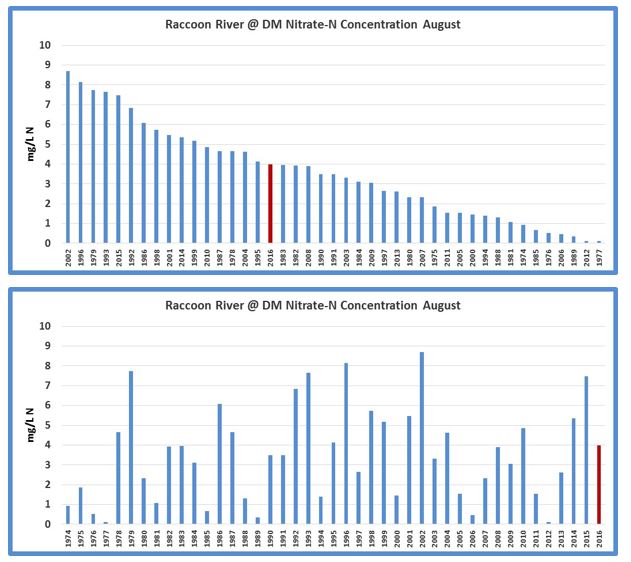
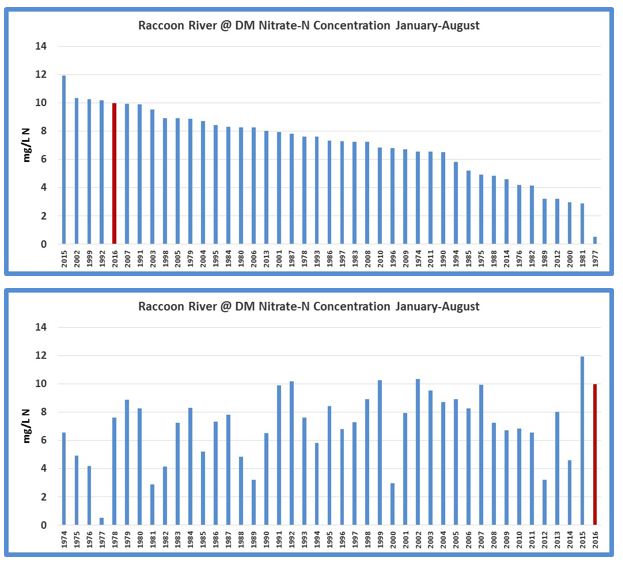
These graphs illustrate nitrate-N in the Raccoon and Des Moines Rivers (at Des Moines). Each graph is duplicated; in the first, the data is sorted by magnitude, in the second, the data is sorted chronologically. Loads are the total mass of nitrogen delivered by the river. Concentration is reported as an average of the daily values in milligrams per liters (mg/L) with linear interpolation for non-analysis days. Graphs show August values, and the year-to-date values through August 31 (i.e. January-August).

A graph showing the Nitrate-N load of the Des Moines River in August, 2016
Des Moines River August Nitrate-N Load
A graph showing the Nitrate-N load of the Des Moines River, Year to Date 2016
Des Moines River YTD Nitrate-N Load
A graph showing the Nitrate-N load of the Raccoon River in August, 2016
Raccoon River August Nitrate-N Load
A graph showing the Nitrate-N load of the Raccoon River, Year to Date in 2016
Raccoon River YTD Nitrate-N Load
A graph showing the Nitrate-N load of the Des Moines River in August 2016
Des Moines River August Nitrate-N Concentration
A graph showing the Nitrate-N concentration, Year to Date 2016
Des Moines River YTD Nitrate-N Concentration
A graph showing the Nitrate-N concentration of the Raccoon River in August 2016
Raccoon River August Nitrate-N Concentration
A graph showing the Nitrate-N concentration of the Raccoon River, Year to Date 2016
Raccoon River YTD Nitrate-N Concentration