Cities along the Cedar River and some of its tributaries just experienced an historic flood over the past two weeks, with river stages reaching their 2nd-highest level ever only eight years after the devastating 2008 deluge. The flood also delivered a lot of nitrate-nitrogen to the stream network, where it then reaches the Mississippi River and eventually the Gulf of Mexico. Elevated nutrients in the Gulf cause hypoxia, an area of depleted dissolved oxygen where fish and other ocean life cannot survive (link).
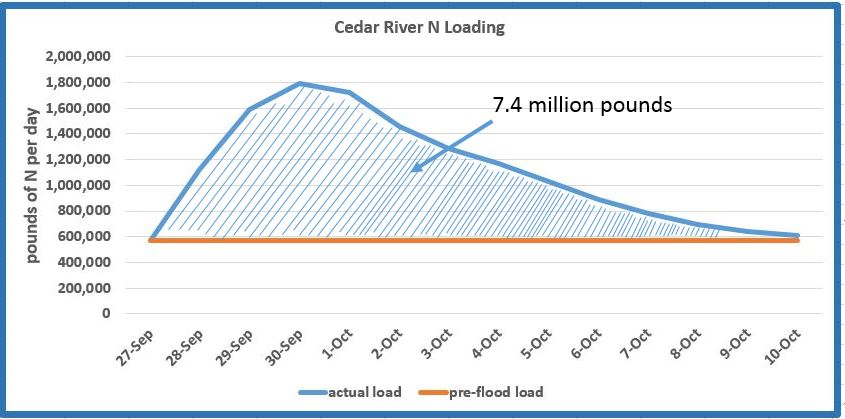
How much “extra” nitrate did the flood deliver? Looking at the IIHR sensor data near the mouth of the Cedar at Conesville (link) can give us an idea. Before the flood, nitrogen load in the river was 568,000 pounds per day. The graph shows how the nitrogen load increased with the flood. The blue line shows the actual load, and the orange line the “baseline” load that was observed before the flood began. The hatched area between the lines represents this extra load delivered by the flood.
The hatched area totals 7.4 million pounds more than what otherwise would have been the load, had it stayed the same since September 27. One can make the argument that this “extra” nitrogen was vulnerable to loss and may have entered the stream network anyway at some future date. This is probably true to some extent. Nonetheless, it’s interesting to consider how these extreme events impact water quality. We probably cannot afford the engineering that would be necessary to tame the effects on water quality of such events. Thus, changes like more perennial plant cover and alternative cropping systems will be necessary if we want to mitigate the effects of these extreme events.