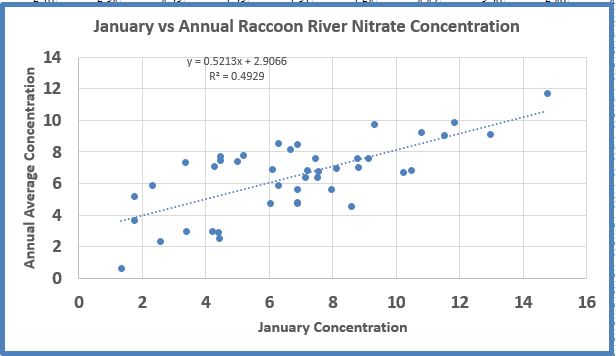
January is only one of 12 months, but in fact it is not a bad predictor of where the annual average Raccoon River nitrate will settle 11 months from now. This January, nitrate levels have averaged about 6.7 mg/L. When January nitrate was between 6 and 8 mg/L in the period of 1974-2016, annual nitrate ended up between 4.7 and 8.5, a much tighter window than the entire range of observed annual averages (0.6 to 11.7 mg/L). The overall long term annual average is 6.6 mg/L. Based on this I am predicting a below average-to-average year for Raccoon River nitrate.
It makes some sense that January nitrate has a predictive power for the year. This is because most of the stream water right now is tile and groundwater, the predominant drivers of river nitrate concentrations. January nitrate gives us an idea of how “hot” the tiles will be later in the year. January nitrate was very high the previous two years (14.8 and 11.5 mg/L, 2015 and 2016 respectively). After a lot of wet weather in recent years, the Raccoon landscape may be depleted of some nitrate compared to previous years.
Sort of surprisingly, August nitrate is the best predictor of annual average. My thinking is that August rainfall is highly variable, and that August rain (or lack thereof) is a powerful driver of tile flow in the subsequent months heading into winter, when no crop uptake of water is possible.
I have not explored how relevant this is for other Iowa rivers.