
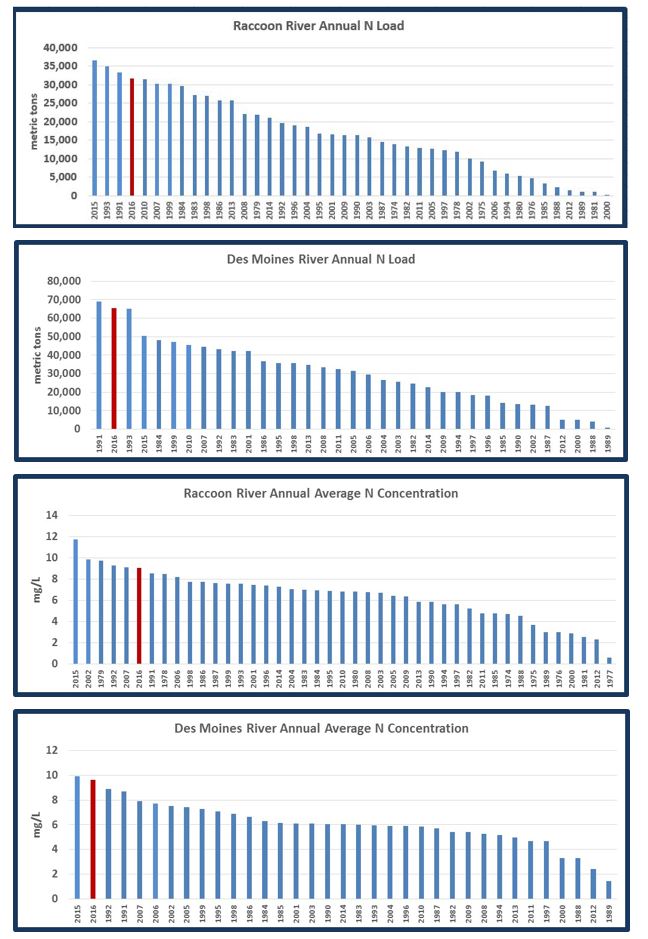
I first posted this last week, and made some mistakes in process. I used English Tons units for the load instead of my tradtional metric tons. Thus the 2016 loading numbers were about 10% higher than what they should have been. This made 2016 at the Des Moines River (at 2nd Ave in Des Moines) the second highest loading year ever (not the highest as reported earlier). The rest of the post remains essentially the same. I have inserted corrected graphs.
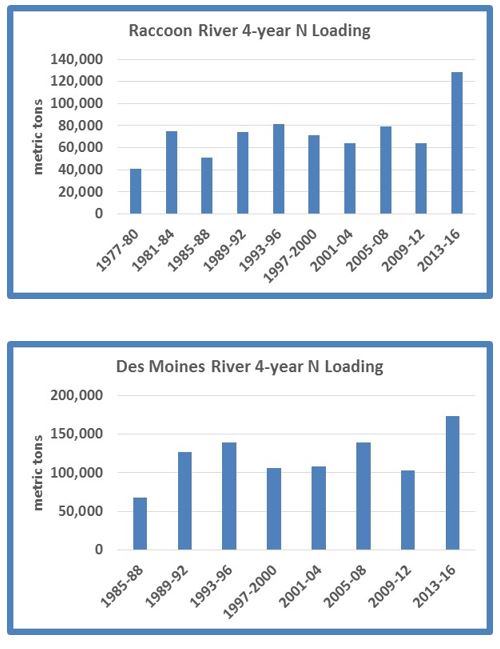
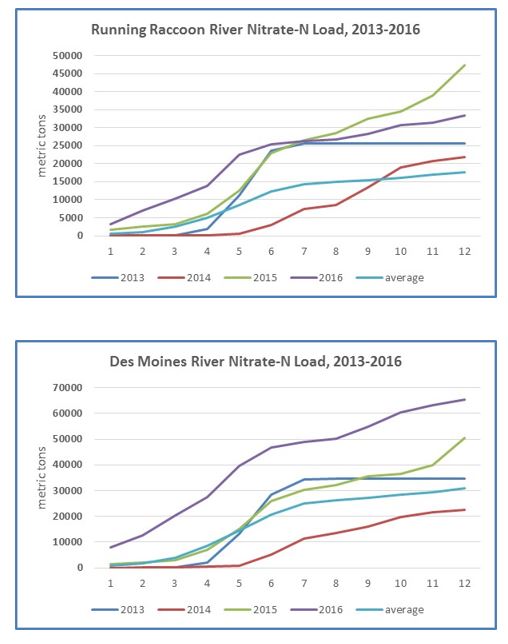
The past four years that have elapsed since the 2012 drought have all been pretty remarkable for nitrate levels (with the possible exception of 2014 Des Moines River). 2013-2016 was the largest four-year N loading in the historical record for both rivers. In addition, the ten years that have elapsed since 2007 is similarly the highest 10-year loading period in the record. Graphs below illustrate this.
Total river discharge (flow) was 7th-highest in 43 years for the Raccoon; 4th-highest in 35 years for the Des Moines. In the graph below I show discharge normalized to watershed area. In an average year, the Raccoon River watershed gets 866 mm of precipitation and 24% of that (208 mm) leaves the watershed in the river. This ratio of discharge (Q) to precipitation (P) is a strong predictor of river nitrate. Large values for Q/P almost always mean large nitrate loadings. The past two years, Q/P has averaged 0.38 in the Raccoon Watershed, well above the 0.24 average.
I began working on paper about three years ago that showed a modest decline in Raccoon River nitrate concentrations from 1999-2014. The paper finally got to print in the Journal of Soil and Water Conservation in early 2016. By that time, it was apparent that nitrate levels were on their way back up. This shows the peril associated with talking about water quality trends. Looking backward on water quality does not enable a person to predict the future.
1,678,464,652 pounds of nitrogen have been transported by the Raccoon River to its confluence with the Des Moines River in downtown Des Moines since 1974. For the Des Moines River, the figure is 2,385,314,891 pounds since 1982, for a combined total of 4,063,779,543 pounds, enough for a one-year fertilization of 27 million corn acres.
2016 summary in pdf form. 2016-nitrate-summary-for-raccoon-and-des-moines-rivers