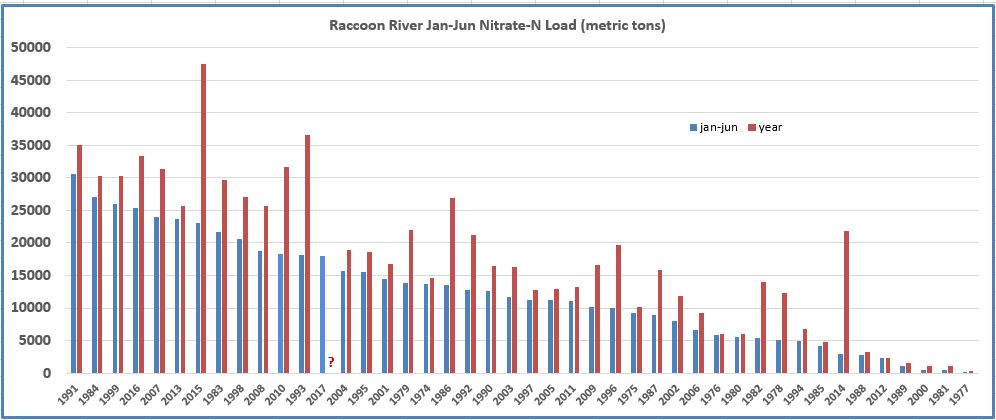
Load is the total mass of a pollutant transported by a stream over a defined time period. The graph below shows Raccoon River nitrate loads (metric tons) from January through June (blue bars) versus the annual load (red bars). The years are arranged according to the magnitude of the Jan-Jun load. You can see where each year was after six months, and where it was after 12 months. Clearly in most years, the bulk of the annual load is transported in the first six months, on average about 70%. There are exceptions, especially in recent years, with both 2014 and 2015 having very large second-half loads.
It is interesting that 70% of the N load occurs in the Jan-Jun period when only 51% of annual precipitation occurs in that window. Reasons for this:
- June is the rainiest month on average and much of that water is still draining to streams in the second half (July primarily).
- Crops are maturing and consuming large amounts of water in July-August period.
- Nitrate that gets to streams is more likely to be consumed by algae and other organisms in the late-summer and early-fall period.
- As the year wears on, the supply of nitrate on the landscape gets depleted by by crops, leaching, denitrification, and volatization to the atmosphere.
So what is in store for the rest of 2017? Three other years had very similar first half nitrate loads: 2008, 2010, and 1993. Those years were all very wet compared to this year. Loading this year is actually fairly large considering the amount of precipitation we’ve received. I’m writing this on July 12 and recent weeks have been hot and relatively dry. It will take a lot of rain to produce large loads over the next 2-3 months. Therefore my expectation is that loading during the second half of 2017 will be on the low side of average.
