Clear back in February of 2017 I wrote this in a blog post: “January is only one of 12 months, but in fact it is not a bad predictor of where the annual average Raccoon River nitrate will settle 11 months from now. This January, nitrate levels have averaged about 6.7 mg/L. When January nitrate was between 6 and 8 mg/L in the period of 1974-2016, annual nitrate ended up between 4.7 and 8.5, a much tighter window than the entire range of observed annual averages (0.6 to 11.7 mg/L). The overall long term annual average is 6.6 mg/L. Based on this I am predicting a below average-to-average year for Raccoon River nitrate.”
So, how did this prediction pan out? Not bad, if I say so myself. Raccoon River nitrate-N concentration averaged 5.6 mg/L for the entire 2017 calendar year. The long term (1974-2017) average is now 6.4 mg/L. So of course this begs the question, what about 2018? Average January 2018 concentration was 3.9 mg/L. In the six previous Januaries where concentrations averaged below 4 mg/L (1975, 1976, 1977, 1982, 2012, 2013, and 2014), the annual average concentration exceeded 6 mg/L only one time (2014—7.3 mg/L). Based on this, I think the average for the year will again be around 6 mg/L. (Side note: it is curious that the years with January nitrate below 4 mg/L are mostly in two clusters of three: 1975-77 and 2012-14).
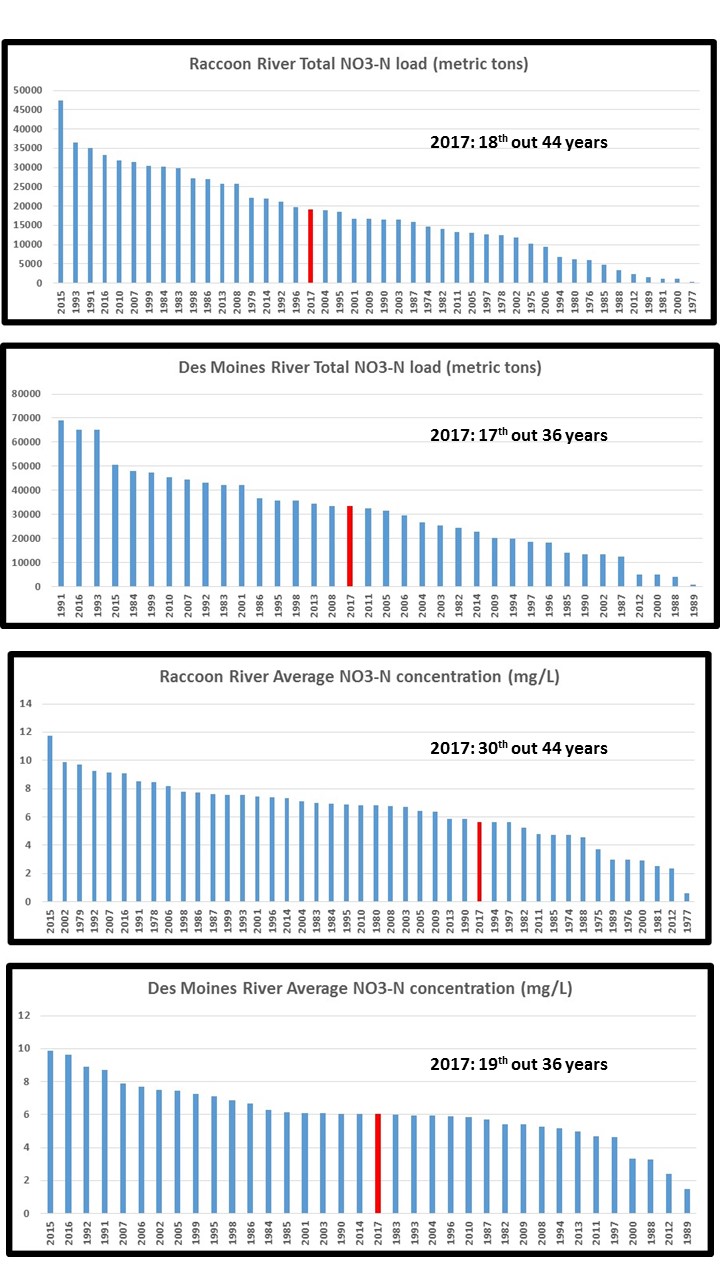
Anyway, the graphs here show how 2017 stacks up against the historical record.