Over the next few weeks I am going to post 2017 nitrate data summaries for many Iowa watersheds. These summaries are an aggregation of IIHR and USGS water quality sensor data, Iowa DNR ambient monitoring data, and USGS discharge data. Most of this data is in the metric system, sorry if that isn’t your thing. A key to some of the terms and abbreviations:
Load: total mass of a pollutant transported by a stream over a defined period of time. This is shown in kilograms (kg) in the data below.
Discharge (Q): total amount of stream water traveling past a defined point. This is shown cubic meters per day (m3/day) and millimeters (mm) below. I calculate discharge in mm by dividing the total water volume by the watershed area. This is a convenient way to look at discharge because you can compare it with precipitation in the same units. We also call this method of looking at discharge water yield.
Precipitation (P): average of all the Iowa State Mesonet weather stations in the watershed. I report this in mm.
Q/P: discharge to precipitation ratio. This oftentimes is an important driver for water quality.
Concentration: mass of a pollutant per unit volume of water. I report this as milligrams per liter (mg/L) which is the same as parts per million. My monthly average concentrations are derived from daily averages. For the sensor data, there are 288 measurements per day.
Flow weighted average (FWA) concentration. This is the total load divided by the total discharge. So this is not a daily or monthly average per se, but imagine if we were able to collect in a container all the river water over a defined time period (month or year) and then measure the nitrate concentration in that huge sample. That is FWA. For nitrate, this is oftentimes higher than the regular average over the course of a year.
N yield: this is the load of nitrate per unit area. I deviate from the metric system here and report this value in pounds per acre in the graphs.
Finally, I am reporting this data for the 2017 Water Year, which ran from Oct 1, 2016 to Sep 30, 2017. This is a common way that scientists look at stream data.
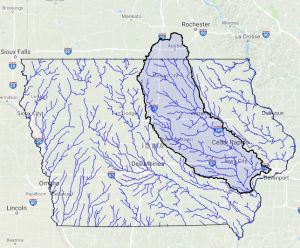
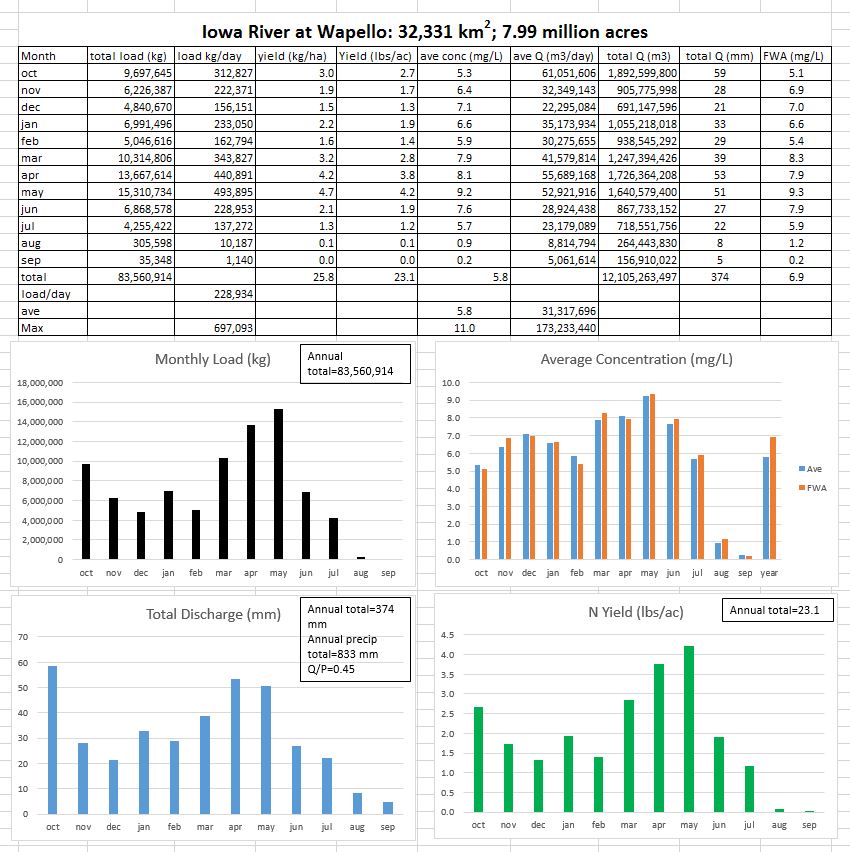
This report is for the Iowa River at Wapello. This is really two fairly similar rivers, the Cedar and the Iowa. At the confluence, the Cedar is actually the bigger river. This basin is the second largest interior Iowa river basin at 7.99 million acres and like the Des Moines River watershed, extends well into Minnesota. The watershed occupies approximately 1/6th of Iowa’s area. The headwaters of the Iowa River are in the heavily-tiled Des Moines Lobe Landform, which was glaciated only 12,000 years ago. Prior to European settlement, this area was dominated by wet prairie and wetland ecosystems. The middle portions drain areas of the Southern Iowa Drift Plain, a hillier area that was last glaciated 500,000 years ago. The lower portions are in the Mississippi Alluvial Plain. The Cedar drains the Iowan Surface, an area shaped by winds blowing off of ice to the north and west. It was a tundra when the Des Moines Lobe was covered with ice. The lower portions of the Cedar drain the Southern Iowa Drift Plain and the Mississippi Alluvial Plain.
Approximately 69% of the land area is in corn and soybean production. Major tributaries include the West Fork of the Cedar River, Shell Rock River, Winnebago River, English River, Clear Creek, Wolf Creek, Beaver Creek and Black Hawk Creek. The Iowa River and its alluvial aquifer supply water to Iowa City and the University of Iowa Water Treatment Plant. The Cedar alluvium provides municipal supply to Cedar Rapids.
Water quality data are shown below. You can see the total nitrate-nitrogen load for the water year was about 83.6 million kilograms.