Over the next few weeks I am going to post 2017 nitrate data summaries for many Iowa watersheds. These summaries are an aggregation of IIHR and USGS water quality sensor data, Iowa DNR ambient monitoring data, and USGS discharge data. Most of this data is in the metric system, sorry if that isn’t your thing. A key to some of the terms and abbreviations:
Load: total mass of a pollutant transported by a stream over a defined period of time. This is shown in kilograms (kg) in the data below.
Discharge (Q): total amount of stream water traveling past a defined point. This is shown in cubic meters per day (m3/day) and millimeters (mm) below. I calculate discharge in mm by dividing the total water volume by the watershed area. This is a convenient way to look at discharge because you can compare it with precipitation in the same units. We also call this method of looking at discharge water yield.
Precipitation (P): average of all the Iowa State Mesonet weather stations in the watershed. I report this in mm.
Q/P: discharge to precipitation ratio. This oftentimes is an important driver for water quality.
Concentration: mass of a pollutant per unit volume of water. I report this as milligrams per liter (mg/L) which is the same as parts per million. My monthly average concentrations are derived from daily averages. For the sensor data, there are 288 measurements per day.
Flow weighted average (FWA) concentration. This is the total load divided by the total discharge. So this is not a daily or monthly average per se, but imagine if we were able to collect in a container all the river water over a defined time period (month or year) and then measure the nitrate concentration in that huge sample. That is FWA. For nitrate, this is oftentimes higher than the regular average over the course of a year.
N yield: this is the load of nitrate per unit area. I deviate from the metric system here and report this value in pounds per acre in the graphs.
Finally, I am reporting this data for the 2017 Water Year, which ran from Oct 1, 2016 to Sep 30, 2017. This is a common way that scientists look at stream data.
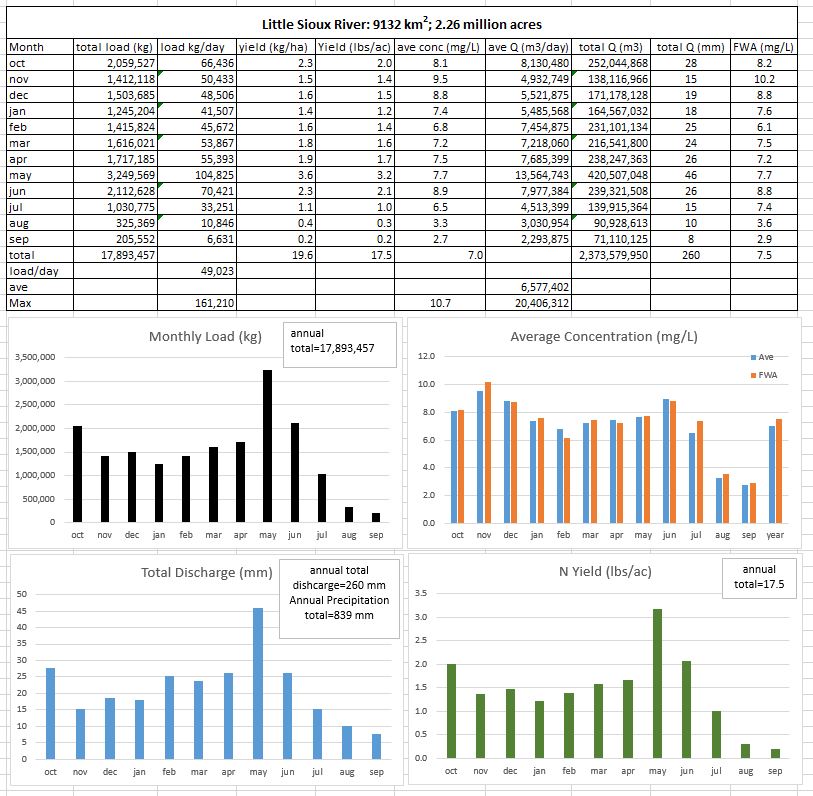
This report is for the Little Sioux River at Turin. The Little Sioux flows 258 miles from its Minnesota source just north of the Iowa Great Lakes to its confluence with the Missouri River near the town of Little Sioux. Draining 2.26 million acres, it is the largest Iowa watershed draining to the Missouri River and the fourth largest draining directly to one of two majors (Mississppi and Missouri). The middle stretch is unquestionably the most scenic river in Western Iowa and maybe the entire state, and Jesse James reportedly used the rugged valley as a hideout. The lower stretch has been straightened and ditched and has a highly disturbed ecology. The Sioux Indians called the stream the Stone River.
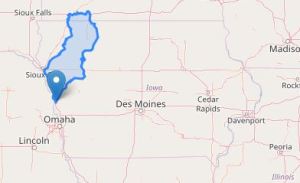
The Little Sioux has three major tributaries: West Fork of the Little Sioux, Ocheyeden, and the Maple River, the last of which is a fairly large river in its own right.
Iowa has nine major landforms, and to the best of my figuring, the Little Sioux is the only river that travels through as many as five of them: Des Moines Lobe, Northwest Iowa Plains, Southern Iowa Drift Plain, Loess Hills, and the Missouri Alluvial Plain. Approximately 79% of the land area is in corn and soybean production.
Water quality data are shown below. You can see the total nitrate-nitrogen load for the water year was about 17.9 million kilograms.