Over the next few weeks I am going to post 2017 nitrate data summaries for many Iowa watersheds. These summaries are an aggregation of IIHR and USGS water quality sensor data, Iowa DNR ambient monitoring data, and USGS discharge data. Most of this data is in the metric system, sorry if that isn’t your thing. A key to some of the terms and abbreviations:
Load: total mass of a pollutant transported by a stream over a defined period of time. This is shown in kilograms (kg) in the data below.
Discharge (Q): total amount of stream water traveling past a defined point. This is shown in cubic meters per day (m3/day) and millimeters (mm) below. I calculate discharge in mm by dividing the total water volume by the watershed area. This is a convenient way to look at discharge because you can compare it with precipitation in the same units. We also call this method of looking at discharge water yield.
Precipitation (P): average of all the Iowa State Mesonet weather stations in the watershed. I report this in mm.
Q/P: discharge to precipitation ratio. This oftentimes is an important driver for water quality.
Concentration: mass of a pollutant per unit volume of water. I report this as milligrams per liter (mg/L) which is the same as parts per million. My monthly average concentrations are derived from daily averages. For the sensor data, there are 288 measurements per day.
Flow weighted average (FWA) concentration. This is the total load divided by the total discharge. So this is not a daily or monthly average per se, but imagine if we were able to collect in a container all the river water over a defined time period (month or year) and then measure the nitrate concentration in that huge sample. That is FWA. For nitrate, this is oftentimes higher than the regular average over the course of a year.
N yield: this is the load of nitrate per unit area. I deviate from the metric system here and report this value in pounds per acre in the graphs.
Finally, I am reporting this data for the 2017 Water Year, which ran from Oct 1, 2016 to Sep 30, 2017. This is a common way that scientists look at stream data.
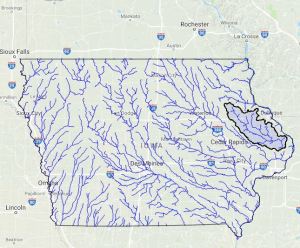
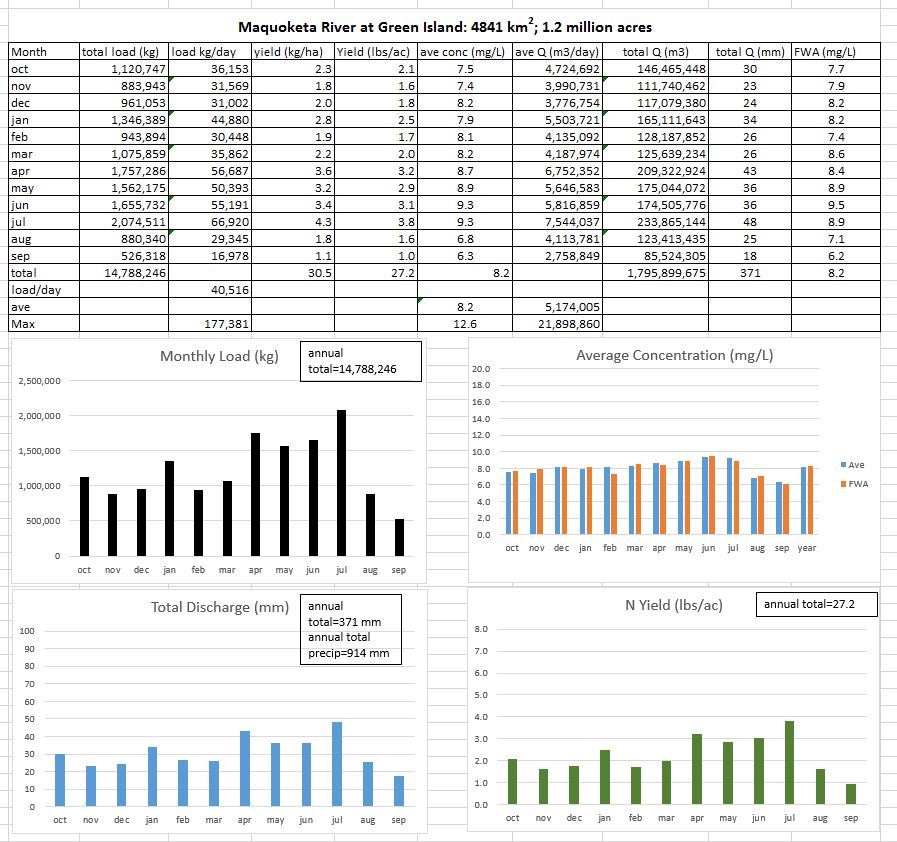
This report is for the Maquoketa River. Known as the Bear River to the Meskwaki Indians, it winds about 150 miles from Fayette County to its confluence with the Mississippi River at Green Island. The North Fork of the Maquoketa is its main tributary. It drains the Iowan Surface and Eastern Central Drift Plain landforms primarily. The stream is one of Iowa’s best and most popular for angling and paddling.
Similar to the Wapsi, water quality is generally good overall, the Maquoketa does transport a lot of nitrate (27 pounds per acre of land), especially when you consider it has a relatively low area portion in row crop (58%). Another interesting feature of the Maquoketa is that its nitrate concentration did not vary much from month to month.
Water quality data are shown below.