Over the next few weeks I am going to post 2017 nitrate data summaries for many Iowa watersheds. These summaries are an aggregation of IIHR and USGS water quality sensor data, Iowa DNR ambient monitoring data, and USGS discharge data. Most of this data is in the metric system, sorry if that isn’t your thing. A key to some of the terms and abbreviations:
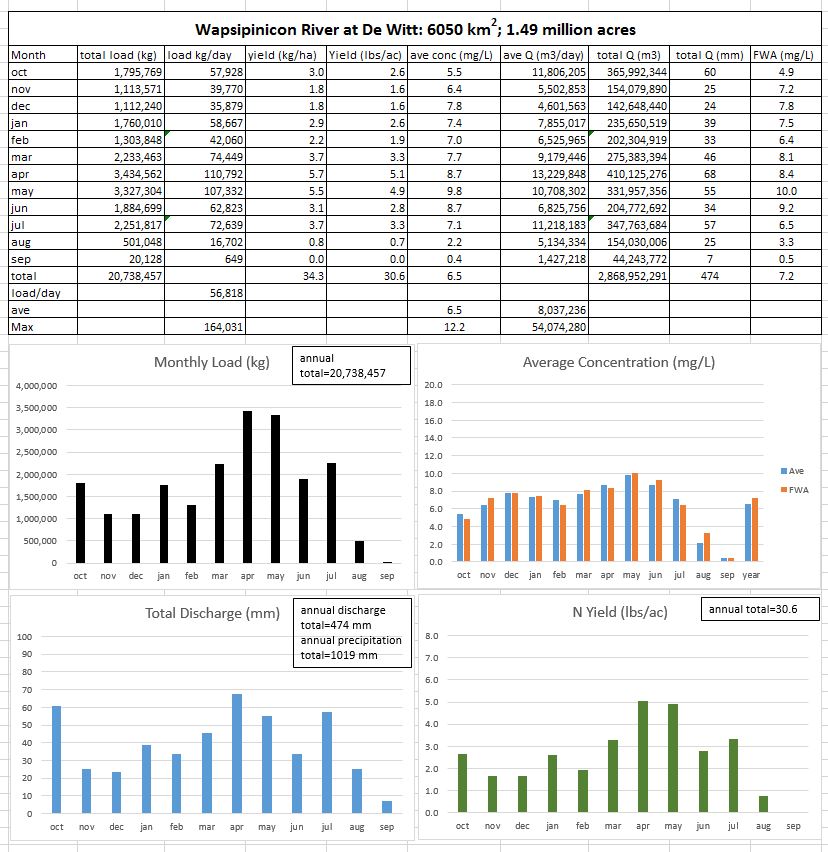
Load: total mass of a pollutant transported by a stream over a defined period of time. This is shown in kilograms (kg) in the data below.
Discharge (Q): total amount of stream water traveling past a defined point. This is shown in cubic meters per day (m3/day) and millimeters (mm) below. I calculate discharge in mm by dividing the total water volume by the watershed area. This is a convenient way to look at discharge because you can compare it with precipitation in the same units. We also call this method of looking at discharge water yield.
Precipitation (P): average of all the Iowa State Mesonet weather stations in the watershed. I report this in mm.
Q/P: discharge to precipitation ratio. This oftentimes is an important driver for water quality.
Concentration: mass of a pollutant per unit volume of water. I report this as milligrams per liter (mg/L) which is the same as parts per million. My monthly average concentrations are derived from daily averages. For the sensor data, there are 288 measurements per day.
Flow weighted average (FWA) concentration. This is the total load divided by the total discharge. So this is not a daily or monthly average per se, but imagine if we were able to collect in a container all the river water over a defined time period (month or year) and then measure the nitrate concentration in that huge sample. That is FWA. For nitrate, this is oftentimes higher than the regular average over the course of a year.
N yield: this is the load of nitrate per unit area. I deviate from the metric system here and report this value in pounds per acre in the graphs.
Finally, I am reporting this data for the 2017 Water Year, which ran from Oct 1, 2016 to Sep 30, 2017. This is a common way that scientists look at stream data.
This report is for the Wapsipinicon River at DeWitt. The Wapsi watershed is the southern- and western-most of five adjacent basins (Wapsi, Maquoketa, Turkey, Yellow, and Upper Iowa) that are probably Iowa’s best in terms of water quality. The name roughly translates to “river abundant with wild artichokes” in the Native American Objibwe language.
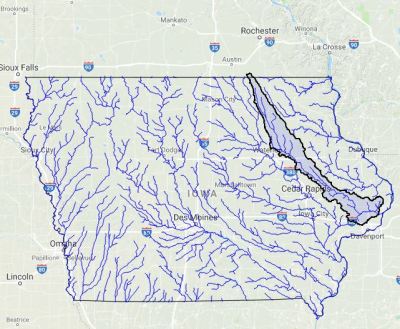
The river begins just a few miles north of the Iowa Border and flows 300 miles to its confluence with the Mississippi just south of Comanche, Iowa. It drains areas of the Iowan Surface almost exclusively. This area is a prehistoric tundra shaped by persistent winds over thousands of years. The watershed is long and narrow and as a result the Wapsi has few large tributaries, with Buffalo Creek and Hunter Creek being two.
The featured image from the blog page is the Anamosa Bridge.
Although water quality is generally good overall, the Wapsi does transport a lot of nitrate. Its 2017 nitrate yield (load per unit area) was one of the highest in Iowa at nearly 31 pounds per acre of land. About 72% of the watershed is cultivated for corn and soybeans.
Water quality data are shown below.