Iowa’s main policy instrument for addressing non-point source nutrient pollution (e.g. that which comes from widely dispersed sources) in our water resources is the Iowa Nutrient Reduction Strategy (INRS). Now a little over five years old, the strategy began with a science assessment of the available practices that could be used to reduce delivery of nitrogen (N) and phosphorus (P) from farmed fields to streams, lakes and aquifers. Farmers can obtain cost share funds allocated by the legislature to offset the cost of implementing these practices, which include things like constructed wetlands and woodchip bioreactors that intercept nutrient-laden drainage tile water, and also cover crops such as winter rye that scavenge unused nutrients following harvest of corn and soy. The INRS also has a point source component that focuses on wastewater treatment plants.
I often get asked if the INRS is working. I also hear people adamantly assert that either it is working, or it isn’t working. It seems there is no middle ground answer on this. The problem here is that these answers aren’t wrong; rather, we may be asking the wrong question. One might also ask what is meant by “working”. If by working we mean “improving water quality”, then the question should be: Could the nutrient strategy work? The answer to that question is yes.
Right now it is difficult to say with certainty that nutrient loading (total mass of N or P transported by a river) is declining in any of Iowa’s 56 HUC8 watersheds. In fact, loads of N and P are very likely increasing statewide. But it really isn’t reasonable to think that nutrient loads should be declining, based on the number of practices that have been implemented as a result of the INRS. For example, the INRS science assessment estimated that about 60-70% of Iowa cropland would need cover crops in order to meet the water quality objective (45% reduction in loads). Right now we have about 3% in cover crops. Still, 3% is 3%, and some watersheds are well above that level. However, trying to measure change at the ecosystem-scale is confounded by year-to-year variations in weather, which are extreme here in Iowa by nature of our mid-continental location. We’re going to need a lot more than 3% to credibly measure change.
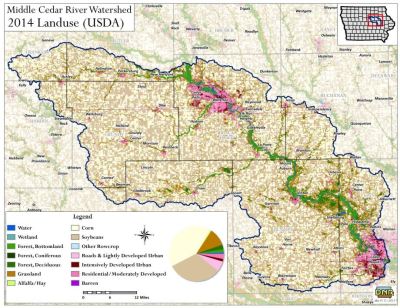
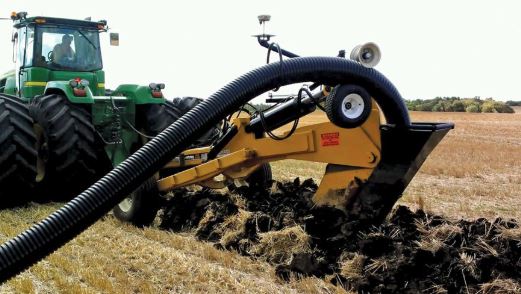
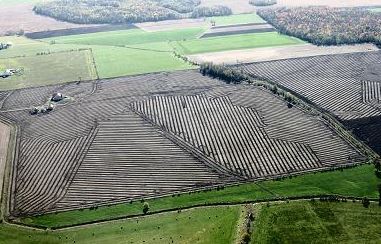
Another huge factor here is that we continue to do things that increase nutrient loading, especially for nitrogen. My colleague Keith Schilling, Iowa’s State Geologist and head of the Iowa Geological Survey, and a UI student working with him, have determined that approximately 1200 miles of new drainage tile are being installed in one of Iowa’s HUC8 watersheds (Middle Cedar) every year. Remember there are 56 Iowa HUC8 watersheds. This drain tile is the main pathway connecting farmed fields and the stream network for nitrate-nitrogen and dissolved phosphorus.
After becoming aware of this 1200-mile number, I decided to throw some water quality data at it. We have nitrate loading data for four sub-watersheds draining to the Middle Cedar River: Miller Creek, Lime Creek, Mud Creek, and Wolf Creek. I derived an overall nitrate-N loss value of 31.8 pounds per cropped acre for these four basins in aggregate for the water year of 2018 (10/1/17 to 9/30/18). (Caveat: from here on out, assumptions and rough estimates are lurking everywhere). Going forward, I made an educated guess that newly tiled land would see its nitrate loss increase by factor of 1.5, or in the case of the Middle Cedar watershed, about 15.9 more pounds of N per cropped acre. This is probably conservative for ground that was previously un-tiled; maybe an overestimate for ground that already had some tile.
From there I estimate that an acre of land that is pattern-tiled in 30’ increments will require 1452 feet (0.275 miles) of tile. Those 1200 miles of tile would therefore drain 4364 acres of land. Increasing the nitrate-N loss by 15.9 pounds on those acres would increase Middle Cedar Watershed nitrate-N loading by 69,388 pounds in 2018. So, just to quench the increased N loss from this new tile installed in one year in this one watershed would require:
- 136 woodchip bioreactors (we currently have about 50 statewide), or,
- 3 constructed wetlands (currently we have about 100 statewide), or
- Around 7000 new acres of cover crops (currently we have 760,000 statewide).
So this is the challenge that we face. There is good reason to think that the Middle Cedar is not an anomaly when it comes to new tile.
In trying to improve water quality, we know for the most part what works, and how well it will work, with a fair amount of confidence. But, things are changing all around us because of natural phenomena and human decisions—the system does not have stationarity. As this example has shown, simply cataloging implemented practices in a ledger and calling it good is not going to cut it, if our objective truly is to improve water quality. Going forward, we need to have the courage to confront the realities of the challenge we face as state. If we don’t, then we will continue to be frustrated by the pace of improvement.