Although it is one of the most basic aspects of corn production, scientists rarely have empirical (i.e. verifiable by observation) data for fertilization rates beyond the field scale. If livestock manure is part of the fertilization strategy, the farmer may not even know how much nutrient is being applied, unless the manure is analyzed for nutrient content. Thus when we do an analysis of nutrient budgets at the watershed or state scale, we rely on estimates of fertilizer amounts that are based on something other than observation.
One such estimate is available from the U.S. Geological Survey (1). These estimates were deduced from the Association of American Plant Food Control Officials fertilizer sales data and Census of Agriculture (USDA) fertilizer expenditures. This data is available for every county in the U.S. County-level estimates of the amount of nutrients (nitrogen-N and phosphorus-P) excreted by livestock animals is also available through USGS sources (2). These values were derived from estimates of animal populations and the average amounts of N and P known to be in the waste of the various animal species.
It is important to understand that the amount of a nutrient (especially N) excreted by the animal is not necessarily the amount that is physically applied to crop ground. Much of this N is volatilized into the air from the manure-holding structure, or from the field itself following application. That being said, there is evidence that this volatilized nitrogen is deposited in fields near where it was generated (3, 4). Thus it is reasonable to consider the amount excreted by the animals when evaluating N budgets within a defined area.
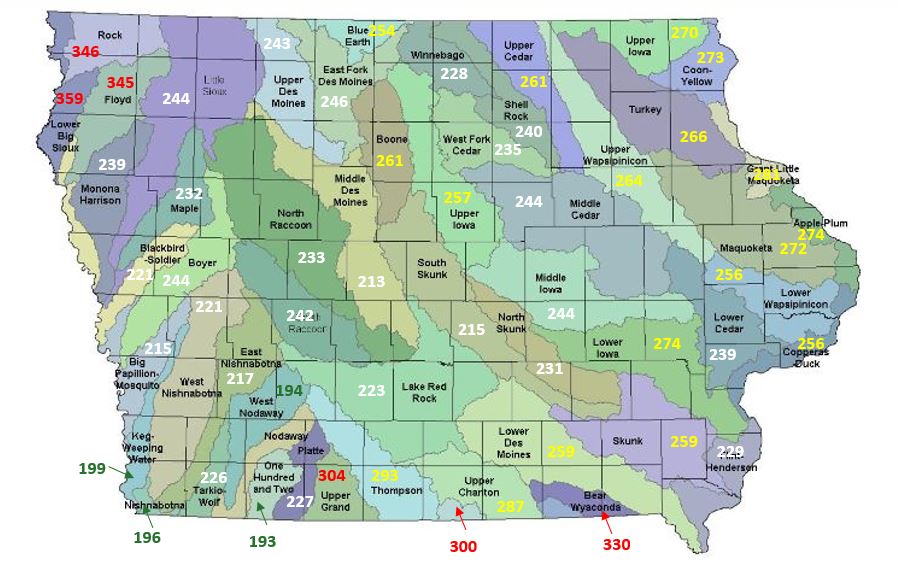
I took this USGS fertilizer data (latest available is 2012), and using the area of each Iowa county planted to corn and the area portion of each county lying within Iowa’s HUC8 watersheds, derived watershed- level N inputs on a per-corn-acre basis. HUC stands for Hydrologic Unit Code and hydrologists look at a hierarchy of HUCs that are nested within one another, with the HUC value inversely proportional to the watershed size. The entire Mississippi Basin is a HUC2, and Iowa HUC8s range in size from 5 to 2500 square miles with an average of 1000 square miles. There are hundreds of HUC8s in the Mississippi Basin, of which 56 are in Iowa. Figure 1 below shows the commercial N plus the excreted livestock N per corn acre in each of these Iowa HUC8 watersheds, based on the USGS fertilizer data and the USDA corn area data.
Iowa State University has recommended N rates to corn based on the current price per corn and the price of a pound of nitrogen. This is called the MRTN—Maximum Return To Nitrogen (5). This should be thought of as the economically-optimal amount of N, not the amount that will maximize crop yields. Assuming N costs $0.40/lb and corn sells for $4.00/bushel, the MRTN is 140 lbs/ac for corn following soybeans and 188 lbs/ac for corn following corn. In 2012 (same year as fertilizer data) 65.8% of Iowa corn followed a previous year’s soybean crop, meaning 34.2% was corn grown in consecutive years in the same space. Using these values, the overall MRTN for the state would be 156 pounds of N per corn acre.
Looking only at commercial N, 53 of the 56 Iowa watersheds are greater than MRTN average of 156 lbs/ac, and area-weighting the watersheds gives an overall statewide average commercial N application rate of 191 lbs/ac, 35 pounds (22%) more than the MRTN. When I add in the manure N, the statewide average comes to 254 lbs per corn acre, 98 pounds (63%) greater than the MRTN. Extrapolated over 14.2 million corn acres, that means we have a “surplus” of 1.4 billion pounds of nitrogen statewide.
So let’s put that 1.4 billion pound surplus in the context of water quality. Since 1999, the average load (mass) of N leaving Iowa in its rivers averaged 580 million pounds per year, about 41% of this surplus. The largest single year was 2016 at 1.25 billion pounds, very similar to the N surplus I just calculated. Take-home message: it seems pretty clear that bringing N inputs in line with crop needs would be an easy and inexpensive path to improved water quality.
- Gronberg, J.M. and N.E. Spahr. 2012. County-level estimates of nitrogen and phosphorus from commercial fertilizer for the Conterminous United States, 1987–2006: U.S. Geological Survey Scientific Investigations Report 2012-5207, from https://pubs.usgs.gov/sir/2012/5207/.
- Gronberg, J.M. and T.L. Arnold. 2017. County-level estimates of nitrogen and phosphorus from animal manure for the conterminous United States, 2007 and 2012, U.S. Geological Survey Open-File Report 2017-1021, https://doi.org/10.3133/ofr20171021.
- Loubet, B., W.A. Asman, M.R. Theobald, O. Hertel, Y.S. Tang, P. Robin, M. Hassouna, U. Dämmgen, S. Genermont, P. Cellier and M.A. Sutton. 2009. Ammonia deposition near hot spots: processes, models and monitoring methods. In Atmospheric Ammonia, 205-267. Springer: Dordrecht.
- McGinn, S.M., H.H. Janzen, T.W. Coates, K.A. Beauchemin and T.K. Flesch. 2016. Ammonia emission from a beef cattle feedlot and its local dry deposition and re-emission. Journal of environmental quality 45: 1178-1185.
- http://cnrc.agron.iastate.edu/