(Iowa Needs Public Land)
You may have heard that the Iowa legislature has been examining a couple of bills regarding public land acquistion in Iowa. I thought I would throw some numbers and images at that discussion.
You’ve probably heard, like me, that Iowa does not have much public land and that we are pretty low on the totem pole in this regard. But since it is risky to just go by things you’ve heard, I did a little digging. There are a couple of ways to look at this: (1) the total amount of public land area and (2) the percentage of the state’s total area that is in public hands (local, state, and federally-held lands).
In terms of the total public land area, Rhode Island has the least: 23 square miles. Rhode Island is the smallest U.S. state at 1555 square miles, or about the size of three Iowa counties combined. All of Rhode Island’s public land would fit into a square of about 5 miles by 5 miles, which is roughly the size of Ames.
Iowa has 1576 square miles of public land, which is 8th smallest of all the states. Six of the states that are below us (RI, DE, CT, MA, MD, and VT) are all small states, the biggest of which, Maryland, is about the size of 22 Iowa counties combined. The very small states of New Hampshire, Hawaii, and New Jersey all have more public land area than Iowa. Hawaii and New Hampshire did not surprise me but New Jersey did, considering that most people have a vision of New Jersey as a concrete-covered metropolis. The other state that is below Iowa in public land area—Kansas—is bigger in total area, about 1.5 times bigger. An agricultural state like Iowa, Kansas has 13 square miles less public land than we do. In terms of the percentage of state area in public hands, Iowa fares worse. We are 3rd lowest after Rhode Island and Kansas, with 2.8% of our land in public hands.
An important question is, what do your public lands look like? You, like me, might have guessed a lot of it is in state parks, but in fact only about 6.7% of our public land lies within state park boundaries (about 68,000 or 106 square miles). Thus all our state parks would about fit into a square 10 miles by 10 miles, about the size of the cities of Des Moines and Urbandale combined. A much larger area of public land, about 585 square miles, comprises Iowa’s Wildlife Management Areas. The balance of our public land lies within city and county parks, state forest land, land that is home to public buildings, and road easements. And farmland. Yes, you read that right—farmland. Of the state’s land holdings, about 29,000 acres are in the DNR’s land lease program. Of this, about 17,000 acres are in row crop, 10,000 acres in other crops, and about 2000 acres are currently idle. If it were all in one place, this farmed, state-owned land would be more than three times larger than our largest state park (Yellow River Forest Camp). In total, state-owned land managed by DNR comprises less than 1% of the state’s area and, suprisingly (to me anyway), 8% of this DNR land is farmed.
“If it were all in one place…farmed, state-owned land would be more than three times larger than our largest state park…”
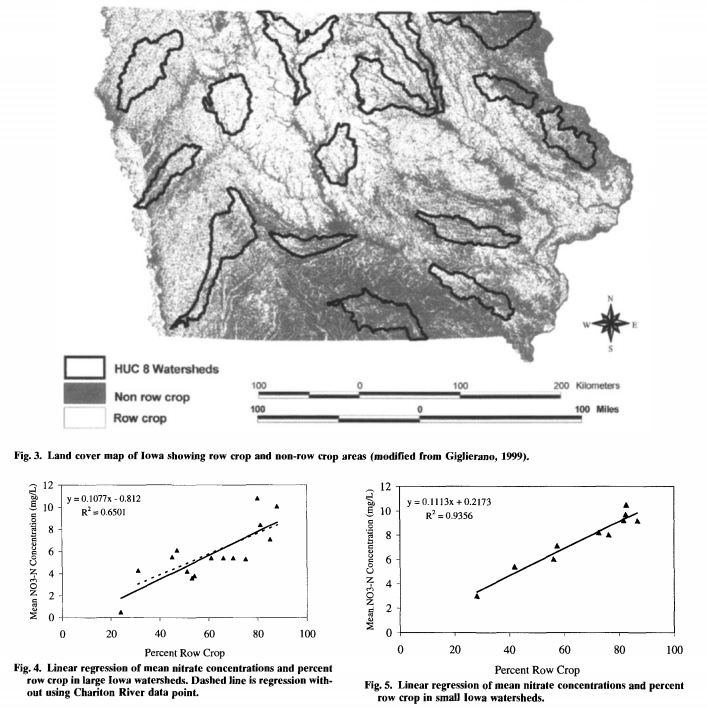
You might wonder if and how this all relates to water quality. In the Iowa Nutrient Strategy Science Assessment, land retirement is the most effective strategy for reducing nutrients (nitrogen-N and phosphorus-P) in the state’s streams, with an expected reduction of 85% for N and 100% for P. We also know that the fraction of land in row crop production relates very strongly to stream nitrate levels, something we call the Schilling equation, named after my colleague, state geologist Keith Schilling. He and the previous state geologist, Bob Libra, published a paper almost 20 years ago that demonstrated that multiplying a watershed’s row crop fraction by 10 would roughly estimate the stream N concentration at the outlet, thus 50% (0.5) in row crop would produce a nitrate concentration of 5 ppm (see graphs below). This applies statewide as well, with about 67% of the state’s land in row crop and the long-term statewide average stream nitrate in the neighborhood of 6-7 ppm. Granted, retiring crop land to a more natural state does not necessarily or even commonly make it part of the public holdings. But this does illustrate the potential of returning land to a more natural state for improving water quality.
Another thing to remember here is that natural lands have a “halo” effect in that they enhance environmental conditions in areas around them. This is clearly noticeable to the physical senses when traveling to places like Minnesota and Colorado, both of which have nearly double the population of Iowa but far more public land. Natural lands restore hydrology, moderate climate, store carbon, reduce flooding, provide habitat and all sorts of other visible and invisible benefits to the areas where we live and work.
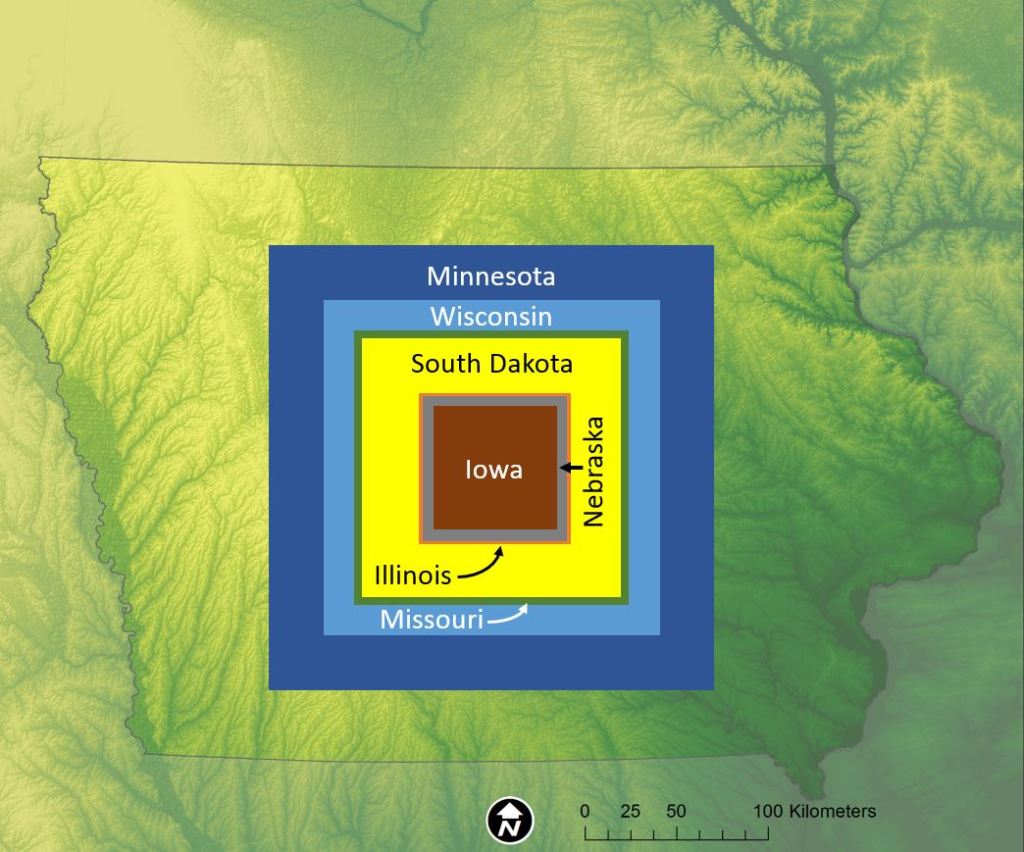
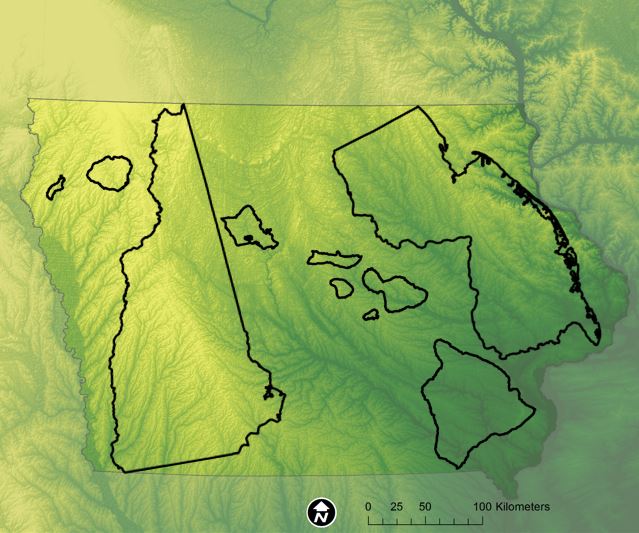
To finish, this might be a good time to mention the long-forgotten Iowa Open Spaces Plan. In 1987 the Iowa legislature addressed the perceived need for additional open spaces in Iowa. They directed Iowa DNR in House File 620 to “prepare a statewide, long-range plan for the acquisition and protection of significant open space lands….” such that 10% of the state’s area (5600 square miles) be included under some form of public open space protection by the year 2000 (that would make our square about the size of South Dakota’s in the above map). Then Governor Branstad, in his second of six terms, signed this bill. As the maps above show, it didn’t come close to happening.
Public land data from US Bureau of the Census, Statistical Abstract of the United States.
Schilling, K.E. and Libra, R.D., 2000. The relationship of nitrate concentrations in streams to row crop land use in Iowa. Journal of Environmental Quality, 29(6), pp.1846-1851.