Iowa has around 3 million people, a total that has not changed much over the last 80-90 years. People are large animals, and as such our bodies produce a lot of waste. That being said, we produce much less waste than the animals that we eat. Take hogs, for example. A feeder pig is about the same size as a human being, but it excretes 3 times as much nitrogen (N), 5 times as much phosphorus (P), and 3.5 times as much solid matter (TS-total solids) (1). Some of this is because of the pig’s diet and some it is because modern hogs grow really, really fast (these things relate to each other, obviously). A pig weighs about 3 pounds at birth and about 250 pounds at slaughter a mere 6 months later, so it is gaining more than one pound per day. By comparison, a human infant gains a pound about every 20 days. There’s a reason we use the word “hog” metaphorically and pejoratively because they consume anything and everything in sight virtually non-stop, which is one reason why they make for a good food animal.
Everybody knows Iowa has a lot of livestock. If you’re like me, maybe you have heard from time to time that our state has enough animals to effectively be as populous as California, using one common example. As you will soon see, it’s bigger than that. Much bigger.
Exactly how many of each species that we have at any one time is a difficult thing to quantify for reasons I will not get into here. I’m going to present some watershed-by-watershed numbers for the following analysis and I do not claim that they are exact, but I have consulted with a couple of experts and I am confident they are in the ball park. Anyway, statewide, we have around 20-24 million hogs; 250,000 dairy cattle; 1.8 million beef cattle, 80 million laying chickens, and 4.7 million turkeys. I did not consider sheep, goats, horses, broiler chickens, deer or Canada geese.
When I apply the N, P and TS values of the waste from these animals, what would be the equivalent-sized human population that would generate such waste is staggering:
- Iowa hogs: equivalent to 83.7 million people
- Dairy cattle: 8.6 million people
- Beef cattle: 25 million people
- Laying chickens: 15 million people
- Turkeys: 900,000 people
In total, these five species generate the waste equivalent to that produced by about 134 million people, which would place Iowa as the 10th most populous country in the world, right below Russia and right above Mexico. (Caveat: obviously Russia and Mexico have their own livestock that I am not counting.) And in terms of population density in the context of N, P and TS waste, Iowa would come close to the country of Bangladesh.
Managing the waste from these animals is possibly our state’s most challenging environmental problem. Of course we have a lot of cropland to apply this waste, but the time windows in which farmers have to do this in without damaging the crops with equipment are usually not large. Wet, cold and hot weather can all limit application. As a result, there are only a precious few weeks in a year when this Mt. Everest of waste can be applied to corn and soybean fields. And there can be no doubt that the sheer amount, and the logistical complications of hauling and handling it, have consequences for water quality (2). Watersheds with the highest density of livestock frequently have some of the highest stream nitrate concentrations (North Raccoon, Floyd, and Rock River watersheds, for example).
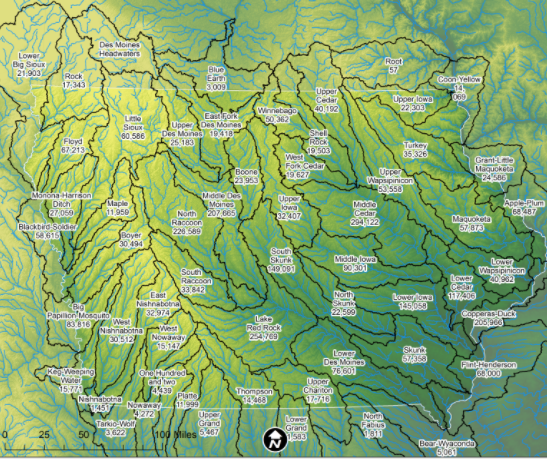
My colleague Dan Gilles, a Water Resources Engineer at the Iowa Flood Center, was able to derive the human population for all of Iowa’s HUC8 watersheds. Dan has been a great collaborator to work with and most days he could run circles around me. Anyway, our most populated watershed, the Middle Cedar, has 294,000 people. Even in that watershed, the human-equivalent livestock population (3.6 million) dwarfs that of actual people. I added the human population to this human-equivalent livestock population for each of Iowa’s HUC8 watersheds and this is illustrated below by relating it to a city or state that has a similar human population. I realize that most people will not know the population of many of these places, and the table that follows will help with that.
To finish up, I present this illustration not to make any value judgments on the livestock industry. Clearly it is an important part of our economy. I think we can and should, however, objectively and dispassionately ask ourselves how much we can accommodate while still being able to achieve our desired environmental outcomes. Denmark and the Netherlands both have livestock densities on the scale of Iowa. As a result, both of these countries have in the past suffered environmental consequences similar to our own, but, both country’s governments have intervened in more forceful ways than ours. I’m not saying this is good, bad, or in between, it’s just true. I think even industry advocates would say there is not much that limits further expansion in Iowa, except perhaps available land in certain areas of the state to apply the waste. Is it reasonable to think about what’s possible when trying to reconcile our desired environmental outcomes with the economic and regulatory considerations the industry wants? If we are going to be honest with ourselves, then I think the answer to that question is yes.

Data table used to derive the maps above.
- http://agrienvarchive.ca/bioenergy/facts.html#Approximate_nutrient_content.
- Jones, C.S., Drake, C.W., Hruby, C.E., Schilling, K.E. and Wolter, C.F., 2018. Livestock manure driving stream nitrate. Ambio, pp.1-11.