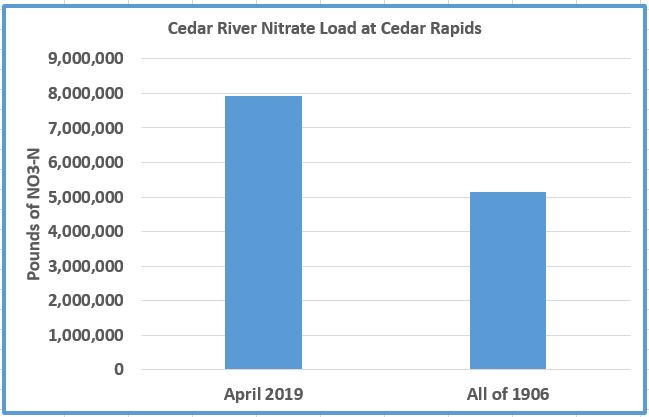
Much of my time is spent analyzing data and I came across a few nuggets that I thought would be of interest. The first concerns Cedar River nitrate. As I said in a previous post, we do have access to empirical data that goes back a long ways, in this case to 1906. I thought about this in looking at Cedar River nitrate data for this past month of April. The nitrate load (total mass transported by the river) for April 2019 exceeded that for the entire year of 1906 (Fig. 1). If I took time to do the math, I think I would find that April 2019 probably exceeded most of the years before 1950.
The second nugget came by way of UI Engineering professor Charles Stanier. He recently led a group of chemical engineering students on a tour of the Iowa Fertilizer plant in Lee County. His group was astonished that the plant produces 5060 pounds of fertilizer nitrogen every minute. For comparison: In 2016, our biggest year for statewide stream nitrogen loss since 1999, 2370 pounds of nitrogen left the state every minute in our rivers, or about ½ the amount produced by the Iowa Fertilizer plant. Last year our statewide stream nitrate loading was 1200 pounds per minute.
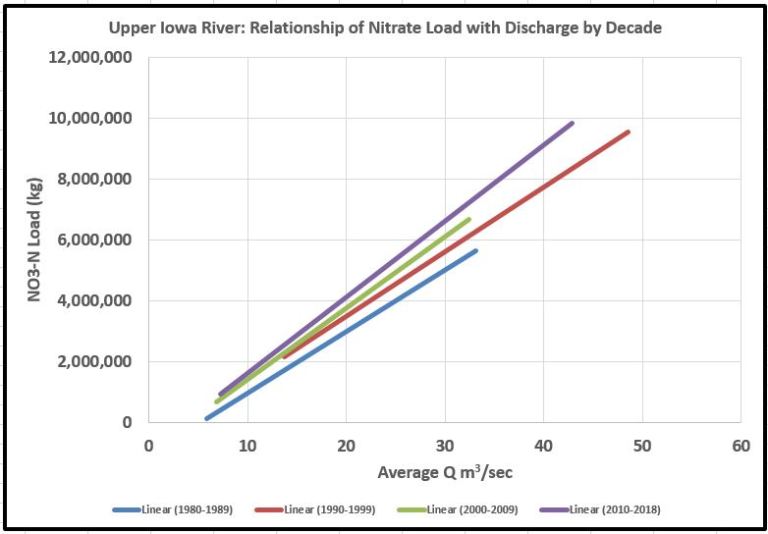
The third nugget came by way of an esteemed colleague here in Trowbridge Hall. He provided me some nitrate loading data for the Upper Iowa River in far northeast Iowa. This is shown in Fig. 2 and requires some explanation. It shows how nitrate load changes with stream discharge (flow) by decade. A good way to look at this graph is to find discharge (Q) on the x-axis, for example, 30 m3/second (these are annual averages). Then follow that line up to see that from 1980-89, an annual average of 30 m3/second produced a nitrate load of about 5 million kg; from 1990-99, 5.7 million kg; 2000-2009, 6.1 million kg; and in the last nine years (2010-2018), 6.8 million kg. Translation: the amount of nitrate delivered per unit of water is steadily increasing as time goes on. This tells us that weather is probably not the driver of increased nitrate loading in this watershed. What is the driver then?
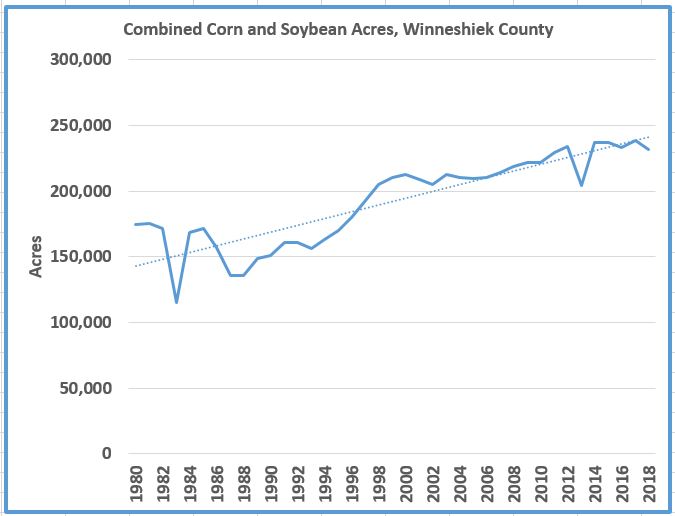
In the Upper Iowa Watershed, the driver is almost certainly the amount of area that is cropped to corn and soybean. Figure 3 shows that area for Winneshiek County, which lies within the heart of the watershed. Clearly refinements to farming methods have been made since 1980, and without a doubt there are more conservation practices on the ground now than in 1980. But these efforts have been unable to overcome the fundamentals of more acres and probably more drainage tile. This illustrates why measuring implemented conservation practices is not predictive of water quality in many cases.