
Buongiorno! I am one of Dr. Jones’ colleagues at UIowa. Dr. Jones graciously agreed to let me guest blog to give you my thoughts on Iowa’s Nutrient Reduction Strategy (NRS). The US Environmental Protection Agency (EPA) asked twelve Mississippi river states to develop the strategies as a means to address water quality, and we just published a paper assessing their progress. You can read the paper if you are interested in how the strategies are working overall, here I will focus on how this approach is working for Iowa.
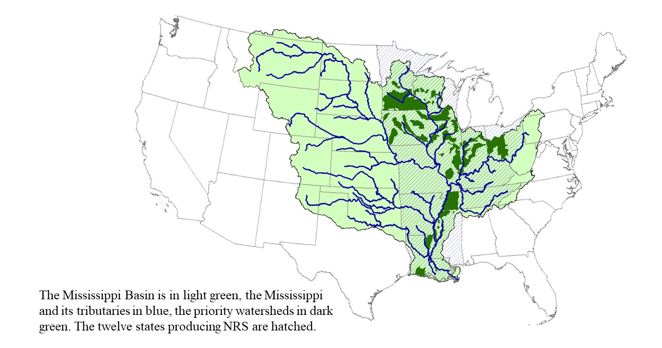
First off, a brief historical recap: Why do the strategies exist, and what are they supposed to do? In short, the strategies exist because too many nutrients get into the Gulf of Mexico, thereby causing hypoxia. To address this problem, the EPA decided against mandating a cap on pollution, that is a, Total Maximum Daily Load (TMDL), or imposing federal Numeric Nutrient Criteria in the Mississippi River basin. Instead, it asked states to develop their own strategies. In the memo outlining how it envisioned these documents, EPA put a strong emphasis on targeting watersheds, setting nutrient reduction goals for those watersheds, and implementing activities to reduce nutrient loads from all sources there. Figure 1 shows the targeted watersheds across the basin.
So, how is Iowa doing? The state made massive efforts in producing the original strategy, updates, and progress reports. By my reckoning, it has produced by far the biggest amount of NRS-related documentation across the twelve states. The issue is – documentation of what? Like many of the other states, Iowa has struggled to reconcile EPA’s request to prioritize watersheds and focus activities there with the need to reduce nutrients loads for the whole state. In the latest progress report of the Iowa NRS, much of the information reported on ongoing activities is statewide, and Iowa has not established numeric goal reductions for the targeted subwatersheds as outlined in the EPA memo.
Iowa has also not produced the information necessary to assess if the strategy is working. Please bear with me as I clarify one of the most important concepts in economics (I should probably mention that I got my PhD from a very fine institution, which I am quite fond of): marginal effects. When economists talk about marginal, they really mean additional, or reflecting a response to a change. To measure a change, you need a starting point (what we typically call a baseline).
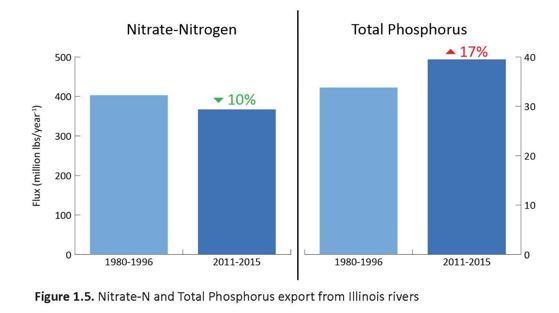
In the latest progress report of the Iowa NRS, the baseline period for statewide changes is the average of 1980-96. The strategy, which was put in place in 2012, had previously used 2006-10 as the benchmark period. The 1980-96 period is the baseline that EPA indicated in the 2008 Action Plan, and that other states, such as Minnesota, were using from when their strategies were put in place. Since what we care about is reducing nutrients in the water, ideally, we would want to see a figure like the one below, which comes from Illinois’ 2015-2017 progress report.
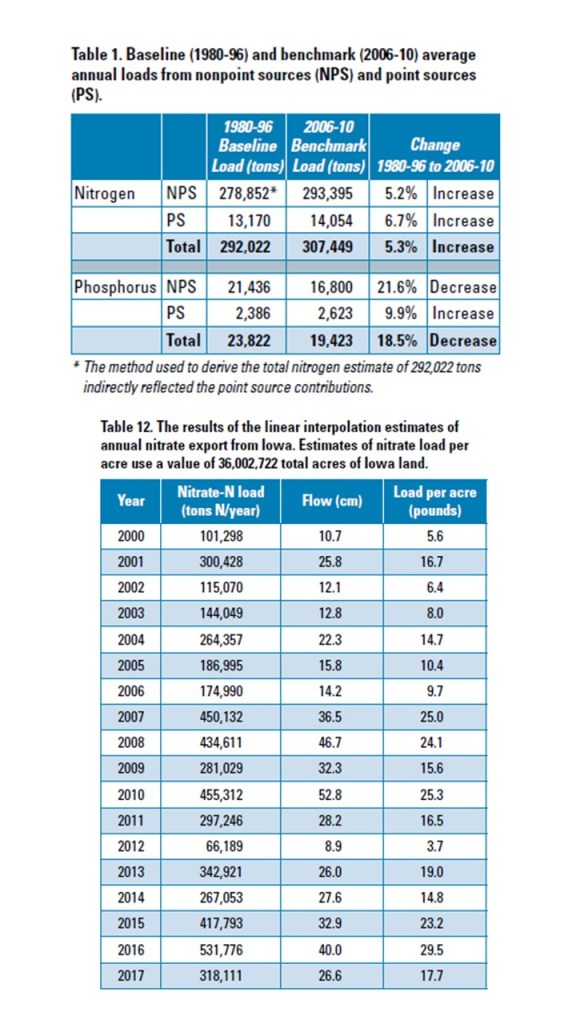
Unfortunately, Iowa’s progress report does not give us this critical piece of information (and yes, I am aware it is a difficult task). With some effort, it is possible to reconstruct what is happening for nitrogen – the report gives a baseline load for 1980 to 1996 of 292,022 tons in Table 1 (shown below), and one can calculate the average load for more recent years from Table 12 (beneath Table 1). By the way, in case you are interested, the average Iowa nitrate-nitrogen load for the 2013-2017 period is 375,531 tons, a 28% increase over the baseline. Instead of focusing on the change in output (water quality), the report emphasizes inputs (such as Best Management Practices), some of which do not have a specific water quality focus. The astute reader will have noted already that I did not say it emphasizes changes in inputs. This again makes it impossible to determine if we are doing better or worse.
Let me give you an example. The Conservation Reserve Program (CRP) takes land out of production. The program started in 1985 with the dual goal of propping up crop prices (by reducing planted acreage) and reducing soil erosion. In 1990, the environmental goal was broadened to include water quality as one of the many factors that determine if a field is to be enrolled in CRP. So, CRP was not primarily intended to improve water quality (except of course via the link between sediment and phosphorous) and now water quality accounts for less than a quarter of the points used to decide if a field is to be enrolled in the program (about half if you include soil erosion). As the report notes, another change has been the shift from general signups, which typically enroll whole fields, to continuous signup of portions of fields. We know that in the 1987-1996 period (I am omitting the first two years as enrollment was ramping up), Iowa had an average of 1.9 million acres in the program. In 2017, enrollment was a bit less than 1.8 million. So, enrollment actually DECREASED from the baseline. The progress report does not say this, and instead notes that there was an increase in 100,000 acres between 2016 and 2017.
The report also notes that only additional activities should be included, but it then goes on to show a figure showing overall funding for 2016-2018, including CRP expenditures (the 2016 update did not include CRP payments). Out of the $512 million spent in the 2016-2018 period, only $21 million (about 4%) was “NRS-focused”. Notably, $318 million (62%) was for CRP rental payments.
When changes in practices are noted in the report, the baseline chosen is not relevant to the question of whether we are doing better than in the 1980-1996 baseline. For example, there is information on nitrogen and phosphorus loss reduction from practices installed through cost-share programs and the Conservation Reserve Program since 2011.
Data availability is certainly a concern when the baseline is 40 years ago, but as I just discussed, CRP data, for example, is available starting in 1986 (including conservation practice and location), and it was not used. Some datasets have in fact gotten worse. The National Resources Inventory (NRI), for example, provides very detailed information for several structural and non- structural conservation practices from 1977 to 1997 (including conservation tillage for the 1987 and 1992 surveys). None of this data was used to establish baseline practices adoption in the report (this is particularly surprising since Iowa State University has played a critical role in the history of the NRI). On the other end of the spectrum, the progress report includes nothing on Confined Animal Feeding Operations (CAFOs). This is unsurprising, as the strategy itself has only one paragraph describing the various types of animal feeding operations. Unfortunately, the omission of this critical portion of the agricultural sector is common to all 12 states, and livestock manure is an important driver of stream nutrient levels.
So, in conclusion, we have a lot of information not pertinent to the question, we are not clearly told if the water is better or worse than at baseline (though we can find out some things if we make an effort), and we are not even considering BMPs to improve CAFOs’ current nutrient management activities. I’ll let you grade the progress report yourselves.
Since Dr. Jones is not responsible for this blog post, if you have comments on what I wrote, you are welcome to do so on Twitter (you’ll have to be parsimonious) @Prof.Secchi.