
Some of you may recall the map from a previous blog post titled “Iowa’s Real Population” that quantified the amount of fecal waste generated by Iowa’s people and livestock. I then related that to the equivalent human population of various places around the U.S. and world (Fig. 1 at right).
Since that time, some folks have been asking me what Iowa looks like relative to other states in this regard, so here goes.
First, my method. I harvested livestock population data for each U.S. state from the recently updated Census of Agriculture using the NASS Quickstats website (1). These animal populations were queried: beef cattle, dairy cattle, hogs, laying chickens, food chickens (broilers) and turkeys. I looked at reference values for the amount of nitrogen, phosphorus, and total solids generated by each type of animal (2), and converted that to a human equivalent. I then added that number to the human population to get a “fecal equivalent population”, which I will call FEP for brevity from here on out. Since US states vary in size from 1545 (Rhode Island) to 665,000 square miles (Alaska), I divided the FEP by the states’ areas to get an FEP density, if you will.
In “Iowa’s Real Population”, I had an FEP for Iowa of 134 million. With the updated USDA data, it’s now 168 million. The number of people commenting on that map following the blog post took me by surprise and actually was a little unnerving, causing me to fear that I had over-calculated. So these updated numbers were a relief.
Anyway, after I divided that number (168 million) by Iowa’s area, and did the same for every other state, Table 1 resulted. So just to ensure clarity, in Iowa we are generating as much fecal waste in every square mile as 2979 people. For reference, Iowa City is the 2nd-most densely-populated city in Iowa and has 2775 people per square mile. So imagine an Iowa-sized Iowa City. That’s how much fecal waste we are generating.
| state | fep/Square mile |
|---|---|
| Iowa | 2,979 |
| Delaware | 2,371 |
| Wisconsin | 1,554 |
| Nebraska | 1,463 |
| Pennsylvania | 1,452 |
| North Carolina | 1,410 |
| Indiana | 1,334 |
| Maryland | 1,280 |
| Ohio | 1,260 |
| Kansas | 1,258 |
| Oklahoma | 1,254 |
| Missouri | 1,227 |
| New York | 1,150 |
| New Jersey | 1,092 |
| California | 1,090 |
| Kentucky | 1,062 |
| Minnesota | 1,058 |
| Illinois | 930 |
| Arkansas | 909 |
| Georgia | 896 |
| Texas | 892 |
| Vermont | 892 |
| Virginia | 891 |
| Connecticut | 887 |
| Tennessee | 882 |
| South Dakota | 868 |
| Alabama | 829 |
| Florida | 771 |
| Rhode Island | 749 |
| Massachusetts | 743 |
| idaho | 679 |
| Mississippi | 649 |
| Colorado | 527 |
| South Carolina | 520 |
| Michigan | 509 |
| Washington | 487 |
| North Dakota | 483 |
| Louisiana | 364 |
| West Virginia | 361 |
| Hawaii | 310 |
| New Mexico | 281 |
| Oregon | 267 |
| Arizona | 255 |
| Montana | 255 |
| Utah | 244 |
| New Hampshire | 242 |
| Wyoming | 197 |
| Maine | 99 |
| Nevada | 96 |
| Alaska | 1.5 |
Table 1: Fecal Equivalent Population (FEP) per square mile of U.S. states.
Now it must be said that some other states do have a lot of livestock animals. The tiny state of Delaware (2nd on the FEP/square mile list) has 52 million chickens; the huge state of Texas has 12.5 million beef cattle and 170 million chickens. Arkansas has more than 200 million poultry birds, although their 930,000 beef cattle still produce more waste than the poultry.
The hog manure generated in Iowa floats our state to the top of the FEP/square mile list. Iowa is home to one out of every three U.S. hogs, with 23 million residing here at any given moment, a number that has increased by 64% since 2002.
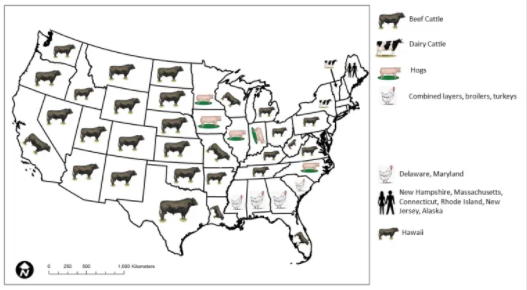
In only six states are human beings the top fecal producer, these all on the east coast except for Alaska. Figure 2 shows the animal producing the most fecal material in each state; for simplicity purposes, the chicken in the map represents the total of all poultry birds (layers, broilers, turkeys).
So how does Iowa relate to our bordering states? Actual human and animal populations, and the human equivalent in fecal waste, are shown in Figure 3. Out of the seven states (IA, MN, SD, NE, MO, IL, and WI), Iowa is 1st in hogs, 2nd in poultry, 3rd in beef cattle, 3rd in dairy cattle, 5th in people, smallest (7th) in land area, and of course first in generated fecal waste, both in total and on a per area basis. Note that Illinois has by far the most people, but produces the smallest amount of fecal waste.

So what does it mean for us? We clearly have a lot of crop area to apply that manure, and it must be said that manure is a good fertilizer and can promote healthy soils. Manure has value beyond just the macro-nutrients of nitrogen and phosphorus. The organic carbon contained within the manure is especially beneficial to crops and soils. However, manure is a much more difficult fertilizer to manage compared to synthetic chemical fertilizers, and manure almost always needs to be accumulated and stored for long periods of time before application to crops. Manure fertilization also presents a lot more uncertainty to the farmer when it comes to precisely determining the necessary amounts commensurate to crop needs. This is why watersheds with dense livestock populations tend to have higher stream nitrate levels (3, 4, 5). I covered many of these topics in previous posts (link, link, link).
I also want to say that we should not ignore that livestock production has a very real beneficial effect for rural Iowa’s economy—transportation, equipment, construction, and meat packing are just a few of the industries that benefit. Read Art Cullen’s book if you don’t believe me.
But if you think our meat appetite comes without profound environmental consequences, read Elizabeth Kolbert (for the record, I am not a vegetarian). In the modern era, the biomass contained within our bodies outweighs that of Earth’s wild mammals 8:1, and when we add in our domesticated food animals, that ratio jumps to 23:1. Imagine what this last ratio must be for Iowa. It’s got to be staggering. Not much of Iowa, America, or Earth for that matter, remains untouched by the feet and the crap of human beings and our horde of animals.
I’ll finish here on a tangent by saying that I get a fair number of comments relating to the blog that fall somewhere along the spectrum of 1) courteous envy that I am able to post my thoughts; 2) astonishment that I would do so; and finally 3) “Do you still work there?” I’m always consciously guarding against sounding pretentious, and I proceed on here at the risk of doing that.
First and foremost, I am trying to put credible (and almost always publicly-available) information and data into an understandable context. In my view, to do that effectively requires adding a perspective. So yes, I add perspective, most often my own.
Secondly and lastly, I worry about the current state of affairs if people are astonished by the mere existence of this type of expression. I can hardly believe we have gotten to this place. I firmly believe that if we are to solve problems, we all ought to be able to talk about them openly, especially when they involve things we hold in common like our lakes, streams, air and wildlife. End.
- https://www.nass.usda.gov/Quick_Stats/
- http://agrienvarchive.ca/bioenergy/facts.html#Approximate_nutrient_content
- Khanal, S., R.P. Anex, B.K. Gelder, and C.F. Wolter. 2014. Nitrogen balance in Iowa and the implications of corn-stover harvesting. Agriculture, Ecosystems & Environment183: 21-30.
- Jackson, L.L., D.R. Keeney and E.M. Gilbert. 2000. Swine manure management plans in north-central Iowa: Nutrient loading and policy implications. Journal of Soil and Water Conservation, 55: 205-212.
- Jones, C.S., Drake, C.W., Hruby, C.E., Schilling, K.E. and Wolter, C.F., 2018. Livestock manure driving stream nitrate. Ambio, pp.1-11.