Someone once told me, “For god’s sake, start at the end” when giving a presentation, and since there is a lot to unload with this one, I’ll give you a couple of nuggets, if you don’t have time to read the rest:
- For the 2019 Water Year (10/1/18 to 9/30/19) Iowa stream nitrate load was 980 million pounds.
- Since 2003, statewide stream nitrate loads have increased 100.4% (i.e. doubled), as measured by the 5-year Running Annual Average.
Ok, here goes:
A “water year” (WY) is a convention used in hydrology to describe the period from October 1 to September 30. Scientists use this when evaluating hydrologic data because autumn and early winter precipitation accumulates in the soil as liquid water or on the surface as snow, and thus doesn’t reach rivers until spring.
Today I am going to present some nitrate-nitrogen (NO3-N) data for the 2019 WY along with similar data accumulated since 1999. This analysis didn’t all happen at once; much of this was aggregated and analyzed a couple of years ago and published in this paper and this paper. This blog post is just an update. Notes on data sources are at the end.
One note now: I do not presume that this accounting is my personal plaything; if somebody else wants to take a stab at this, hey, dive in, the water’s fine (not really).
Herein I look at the state in three ways: areas draining to the Missouri River Basin (31% of Iowa, abbreviated as IAMoRB), areas draining to the Upper Mississippi River (69% of Iowa-IAUMRB), and Iowa as a whole (IATot). There are objective reasons for dividing Iowa in this way—soils, climate, hydrology, and some other things.
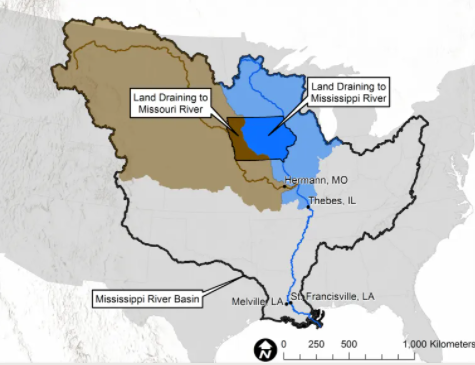
Water from all Iowa streams eventually makes it to the Gulf of Mexico, where a “Dead Zone” develops every year as a result of Midwest nitrogen and phosphorus loss from farmed fields.
The amount (“load”) of NO3-N leaving the state during WY 2019 was 980 million pounds. This was the second-highest load since 1999 (2016 was the biggest—1.25 billion pounds). Of this total (2019), 39% left the state in the Missouri and 61% in the Upper Mississippi. One caveat here: the statewide load includes 2300 square miles of Minnesota that drain into Iowa, about the size of four Iowa counties.
When comparing watersheds, we often look at load per watershed area: NO3-N yield. In 2019 this was 34.2 pounds per acre (lbs/ac) for areas draining to the Missouri; 24.0 lbs/ac for areas draining to the Mississippi; and 27.2 pounds statewide.
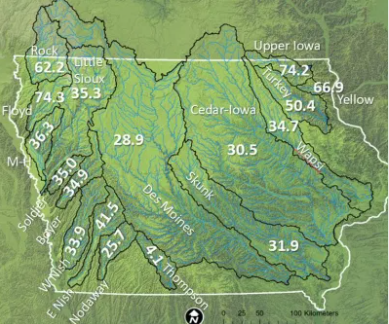
Since greater than 90% of stream nitrate is from agricultural sources in Iowa, we also look at load per cropped area. These values are shown in the map below. Using a current price of $0.31/pound for anhydrous ammonia and with corn at $3.79/bushel, recommended nitrogen application rates range from 145-197 lbs/ac, so you can see that the losses are substantial relative to corn nitrogen needs.
I don’t have precipitation data aggregated, but 2019 was a wet year and river discharge was well above normal. When we calculate water discharge, we often use a convention called water yield. This is water volume per watershed area. Water yield “normalizes” discharge data and allows us to compare apples to apples when looking at watersheds of varying size. Average water yield for Iowa since 1999 is 11.1 inches; in WY 2019 it was 20.7 inches. These values for Iowa areas draining west to the Missouri are 8.7 (average) and 18.8 (2019) inches and east to the Mississippi, 12.0 (average) and 21.4 (2019) inches. Take home: eastern Iowa is wetter than western Iowa.
It’s a good idea not to put too much stock into one individual year when looking at stream pollutant loading. Weather does a play a role in year-to-year variations. It’s not the driver of the problem, but it is important because we’ve removed all the natural resilience from the landscape. To account for anomalous years, we often look at the “5-year Running Annual Average” (5YRAA), which as the term implies, is the average of the current year and the previous four.
The 5YRAA is at its highest level since 2003 for Iowa as a whole (my dataset begins in 1999; the first year I can calculate the 5YRAA is 2003), and for the two sub-regions draining to the Mississippi and Missouri.
Nitrate loading to the Missouri is increasing far faster than areas draining east toward the Mississippi. The 2019 5YRAA is about three times larger for western Iowa than in 2003. For areas draining east to the Mississippi, the increase is 74%, and statewide, 100.4% (i.e. doubled).

Assuming 2013 as a starting point for the Iowa Nutrient Reduction Strategy, the 5YRAA for IAMoRB, IAUMRB, and IATot has increased 77%, 34%, and 46% since then, respectively. That 45% reduction goal? It’s 65% now, if we are to use actual water monitoring data as the metric. This illustrates the folly of trying to measure success by cataloging implemented practices.
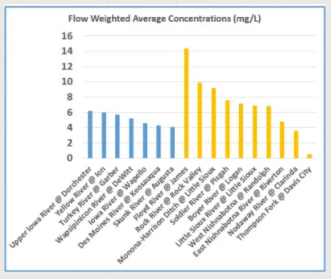
I also look at where a raindrop has its biggest impact—i.e. where does it dissolve the most nitrogen. Here I use the metric of Flow Weighted Average Concentration (FWA). This is the total N load divided by the total water discharge. Units are mg/L (ppm). This is shown the graph below. The NW Iowa watersheds of the Floyd and Rock usually are at the top of the heap, and 2019 was no exception. I tend to think this is because livestock concentration.
Perspectives
The WY 2019 stream nitrate load was just short of a billion pounds. Is that a lot? A billion to us seems like a big number but I can increase or decrease it by changing the units, which are a human construction. So we must put these things in perspective:
- A human being excretes about 10 pounds of nitrogen per year. Thus the fecal and urinary waste of Iowa’s 3.2 million people in 2019 included about 32 million pounds of nitrogen, which is about 3.3% of the total stream load.
- A billion pounds of nitrogen spread out among 85,000 Iowa farmers is ~12,000 pounds per farmer. 12,000 pounds is enough to fertilize about 80 acres of corn (if grown after a previous year’s soybean crop).
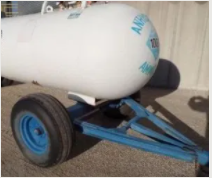
- You would need 236,000 thousand-gallon anhydrous nitrogen nurse tanks (shown below) to hold a billion pounds of nitrogen.
- A billion pounds of anhydrous nitrogen is worth more than $300 million at current prices (note: anhydrous is the usually the cheapest N form of many that farmers buy). Think about what that number might be extrapolated across the several cornbelt states. This is an objective fact: companies are making money selling this lost nitrogen, and taxpayers are asked to shoulder the burden for the resultant pollution.
Final thoughts
I will be surprised if we ever have enough cost share (public) money to address the problem of water quality degradation from nitrate loss. Farmers can buy it for $0.31 per pound but it can cost $2 per pound (or more) to keep it out of our streams. I wrote about this more than two years ago in this space, before anybody read this blog. In that piece, so far read by only 41 people, I calculated that reaching water quality goals for nitrogen using cover crops would cost at least $175 per Iowan per year. Walk down your street and ask a household of four to fork over $700 every year to mitigate nitrate pollution. Something tells me people aren’t going to run to get their checkbook.
One last thought. Why have things degraded so much more in western Iowa in the last 20 years? This is an interesting question. I have some ideas but I don’t really have the answer.
Notes About Data
Stream nitrate data from 1999-2016 is from the Iowa DNR database. Since then, that data has been supplemented with IIHR and USGS real time water quality sensor data. I use linear interpolation to estimate nitrate levels on days without data. This method has been shown to be reasonable.
Stream discharge data is from USGS.
Individual site loads are calculated by multiplying actual or estimated daily nitrate concentrations by stream discharge data.
Region and statewide loads are calculated by looking at overall N yields for the measured areas, and then multiplying that yield by the actual areas of IAMoRB, IAUMRB, and IATot.
Sites do change some from year to year based on data availability. One important watershed—Maquoketa River—dropped out of the monitored areas in 2019.
In total, 79.5% of Iowa is included in the monitored areas; 62.1% of IAMoRB and 89.2% of IAUMRB.
Crop area data is from USDA (NASS).