Plants require nutrients for growth and agronomists divide these into macro- and micro-nutrient groups, depending on the quantity needed. Most important for both crop production and water pollution here in Iowa are the macronutrients of nitrogen (N) and phosphorus (P).
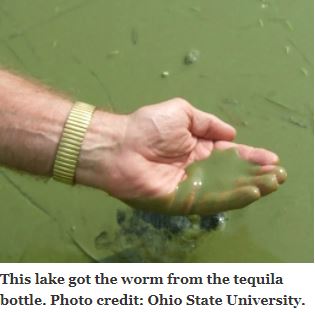
Nitrogen is the beer of the nutrient world. We drink a lot of it, spill a lot of it, and maybe get a little sloppy in the process. Phosphorus, on the other hand, is more like tequila. A couple of shots and before you know it, you’re dancing on the table and trading your clothes for beads. When Mother Nature gets too much P, or starts chasing her P with some N, watch out.
The Iowa Nutrient Reduction Strategy (INRS) Science Assessment determined that 79% of Iowa’s stream P comes from non-point sources (NPS, agriculture, for the most part) with the remainder originating from point sources (PS) like wastewater treatment plant discharge. To meet the state’s 45% reduction goal, the load reduction from each source needed to be 29% (NPS) and 16% (PS).
To reach a percentage improvement goal, you need a reference point. For the INRS, this is the annual average stream load for the period 1980-1996, which was estimated to be 21,436 tons.
Earlier this year, the Iowa Nutrient Research and Education Council (INREC), an affiliate of the Agribusiness Association of Iowa, released a report saying that the annual average non-point source P load had dropped 22% from the 1980-96 baseline, and that “Iowa Agriculture has nearly met the 29% non-point source reduction goal.” This conclusion was “attributed to fewer acres under intensive tillage and significant increase in no-till acres.” Interestingly, the report failed to mention that this presumed improvement also linked back to a decline in soil phosphorus content, but that’s a story for another day. Most importantly, the conclusion did not rely on any water monitoring samples or data. At any rate, the report states that the annual P load now averages 16,800 tons.
That INREC report was like a warm spring rain falling on seeds lying within the detritus of my keyboard. But I had to wait several months for the harvest, which was this week. The harvest coincides with a manuscript being accepted by the Journal of Hydrology on Iowa stream P loading.
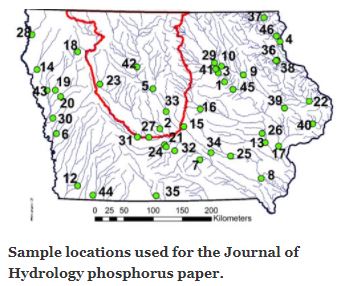
The authors of this paper, Total Phosphorus Export from Iowa Agricultural Watersheds: Quantifying the Scope and Scale of a Regional Condition, are Keith Schilling, Matthew Streeter, me, and two other fellows. If you want to read it and are unable to access it at the link, message me in the comments with your email and I will send it.
We evaluated water quality data at 46 Iowa stream locations over 18 years (2000-2017) from 4,000 samples in total. Although 4000 samples are much better than zero samples (see above), 4000 still isn’t really enough to definitively pinpoint P loads. So we used an established hydrological model to estimate P levels on days that were absent of data.
Our results show that from 2000 to 2017, annual average P load delivered by Iowa streams to the Mississippi and Missouri River Basins was 27,326 tons, about 62% higher than the INREC estimated total and 27% higher than the 1980-1996 baseline total identified by the INRS. The P load for the first nine years of our study (2000-2008) averaged 27,839 tons while the last nine years (2009-2018) averaged 26,812 tons, so we don’t see the statewide total changing much over the past couple of decades, and we certainly do not see a 22% improvement.
We recommend holding off on printing the “Mission Accomplished” sign.
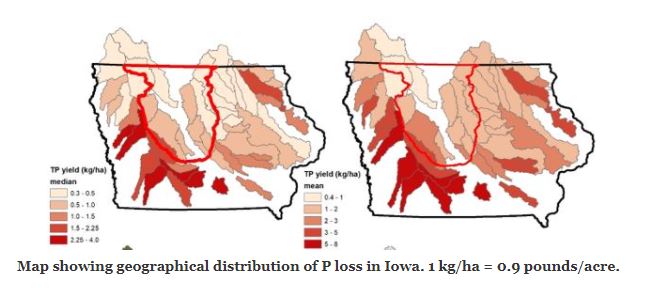
If you’re interested, geographical variation in P loads is shown in the map below. The higher-loss watersheds tend to be the ones with the greatest slope. Phosphorus strongly attaches to soil particles and soil erosion is greatest in hilly landscapes; thus the flat areas of north central Iowa lose relatively small amounts of P while the hilly areas of southern and western Iowa lose far more.
Our analysis also compares Iowa P loads with those entering the Gulf of Mexico. Long-term, we contribute about 15% of the P entering the gulf (we contribute 29% of the N). We occupy about 4.5% of the land area in the Mississippi Basin and deliver about 5.9% of the water. As a whole Iowa loses about 1.5 pounds of P per acre per year. This is about double the rate in the neighboring state of Illinois that has a crop production area and system similar to ours. It should also be said that Illinois has four times as many people and therefore a much larger point source contribution, but it also has far fewer livestock compared to Iowa.
So why the difference between our and the INREC results?
In the conservation business, we tend to measure outputs and outcomes. Everybody does this. They both are important to know. Outputs are things like the amount of money spent, the number of wetlands constructed and so forth. Outcomes in this case means one thing: is the water any better? In a perfect world these things would track together; but you know the rest of that sentence.
The argument exists that there are lag times between implemented conservation and improved water quality. You can lean on that one if you are making progress on reducing inputs (i.e. fertilizer and manure) and/or the imbalance between inputs and crop needs. We aren’t.
I want to finish up with a few comments on the Nutrient Strategy. Like it or not, it is the main tool we have right now for addressing nutrient pollution in Iowa. It's fair to say that it has received substantial criticism from some but also benefited from a tenacious defense provided by some others. Many people forget (or don’t know) that the Obama administration green-lighted the voluntary nutrient reduction strategies of Iowa and other states.
Having observed events connected to the INRS these past seven years or so, I think the most serious threats to it do not come from its detractors. What puts it at most risk are inaccurate claims about its success or progress that imperil its credibility in the eyes of the public. It bewilders me when I read statements like “Iowa Agriculture has nearly met the 29% non-point source reduction goal” that go unsupported by water quality data.
We have a massive socioeconomic problem here at the continental scale. Trying to gaslight a way out of it will end badly.