More than three years ago now I published a paper with colleagues Jacob Nielsen, Keith Schilling and Larry Weber titled Iowa stream nitrate and the Gulf of Mexico. This paper appeared in the journal PLOS ONE which is an open access journal, meaning anyone can read it for free.
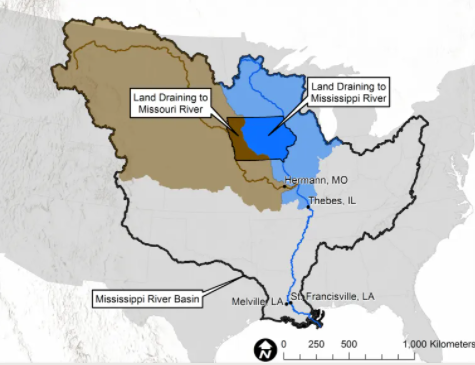
In that paper we quantified Iowa’s relative contributions of nitrate and water to the Missouri, the Upper Mississippi, and the entire Mississippi basins for the period 1999-2016. The beautiful map below, once again made by Dan Gilles, was used in the paper and illustrates the three basins. In terms of area, Iowa land comprises 3.3% of the Missouri Basin, 21% of the Upper Mississippi Basin, and 4.5% of the greater Mississippi Basin.
Since it has been three years, I thought I would update the data. Nitrate data for the larger basins is quantified by USGS and is available through 2019. Iowa data is an aggregate of that collected by UI-IIHR, Iowa DNR, and USGS.
The graph below illustrates the Iowa fractions for area (red line), and the updated Iowa fractions nitrate (green bars) and water (blue bars). A green bar with a magnitude of 0.4 would mean Iowa contributed 40% of the nitrate to that basin in that year, for example.
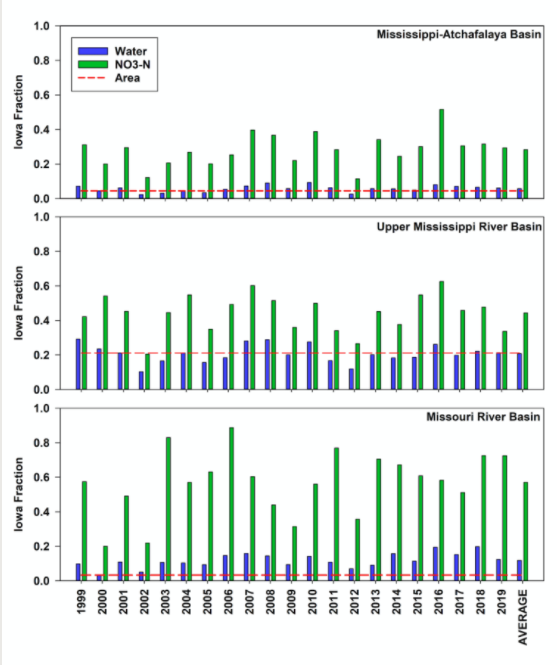
Overall average contributions from Iowa for the entire period of record are shown in the table below.
| Basin | area | nitrate | water |
|---|---|---|---|
| Greater Mississippi | 4.5% | 29.5% | 6.0% |
| Upper Mississippi | 21% | 44.5% | 21.2% |
| Missouri | 3.3% | 57.2% | 12.2% |
In 2001 the Mississippi River/Gulf of Mexico Watershed Nutrient Task Force, a consortium of tribes and federal and state agencies (including those from Iowa), issued an Action Plan to serve as a strategy for hypoxic area (otherwise known as the Dead Zone) reduction. The group’s long-term goal was to reduce the Gulf area where dissolved oxygen is less than 2 ppm to 5000 square km by 2015. Low oxygen levels are driven by nutrients (nitrogen and phosphorus) discharged by the Mississippi River. A revised plan was created in 2008, and 12 US states draining to the Mississippi-Atchafalaya River Basin (MARB) continue to implement the 2008 plan. As of 2017, the 5-year running annual average size of the hypoxic area had remained mostly unchanged since 1994, and the Task Force extended the goal target date to 2035.
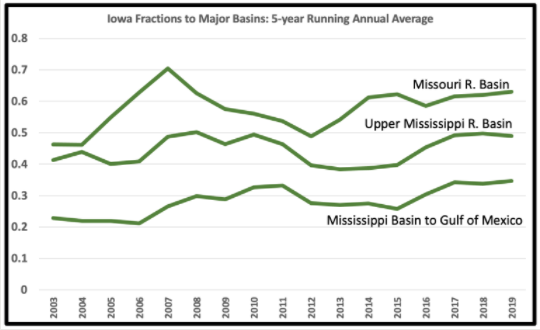
The task force uses the 5-year running annual average because this buffers the large year-to-year swings that can result from weather. Dry weather in the corn belt and hurricanes in the Gulf can both greatly reduce the size of the Dead Zone; likewise floods in the Mississippi Basin can increase it.
I decided to look at the Iowa fractional contribution of nitrate in 5-year running annual averages as well. This is illustrated in the graph below. Our relative nitrate contribution is increasing for all three basins over the period of record. I should also state that our relative contribution for water is also increasing. The nitrate contribution has increased slightly more than the water contribution for the Greater Mississippi and Upper Mississippi Basins; the water contribution is increasing more than the nitrate contribution for Missouri River Basin.