There’s been some news lately about the low flows on the Raccoon River and the impacts on the Des Moines Water Supply. I have a lot of this sort of data at my fingertips for this watershed, so here is a short piece.
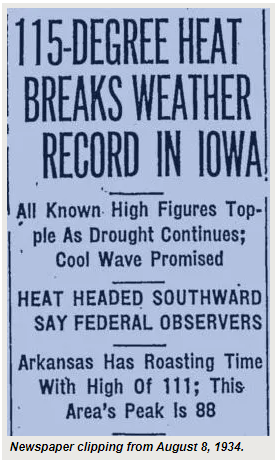
In terms of river discharge, the two lowest (least flow) years were 1934 and 1956. Those are the only two years of the record going back to 1915 where the total runoff from the watershed was less than 1 inch. By runoff I mean the total volume of river flow during the year divided by the watershed area. In an average year, runoff is about 7 inches; the record high is 22 inches (1993).
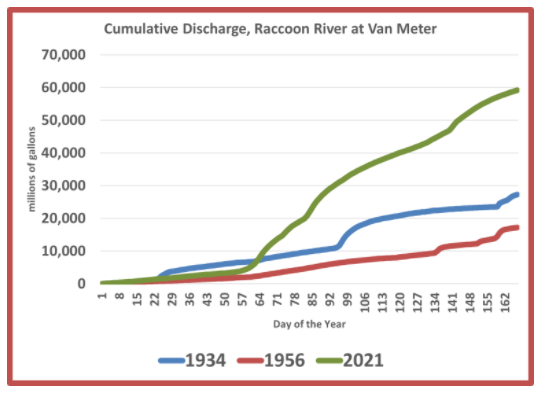
How does 2021 compare? The graph below shows the cumulative amount of water flowing by Van Meter in 1934, 1956 and 2021 through June 16th of each year.
The Raccoon River could go bone dry for the rest of this year and still it will have transported more water in 2021 than either 1934 or 1956 for the entire calendar year.
Long and short: we have had some epic droughts here in Iowa that make this year look like nothing. One big difference though: there are a lot more people in the Des Moines area now that rely on the river for municipal water supply.