I posted an essay in May describing a Water Quality Index (WQI) I developed about five years ago for Iowa DNR with Rick Langel of the Iowa Geological Survey. To summarize, we developed a single-value metric of water quality for Iowa streams based on a formula developed by the province of Alberta and Iowa water quality measurements for dissolved oxygen (DO), E. coli bacteria (EC), total nitrogen (N; nitrate + nitrate + ammonia + organic nitrogen), total phosphorus (P) and turbidity (TURB; clarity).
Since then, I've done further analysis of these data as I'm trying to work this into a journal article to submit for review, and I'm writing this second piece to 1) help me organize my thoughts, and 2) because I think this evaluation will be interesting for general audiences.
I've aggregated water quality data for 44 Iowa stream sites from DNR's website. (In the previous post, I included the Iowa River at Wapello; I left it out of this time because the historical data was too sparse.) Most of this data goes back to 2000, plus or minus a couple of years, depending on the site. I also looked at groups of sites. These groups I list below along with my rationale for clustering the streams the way that I did.
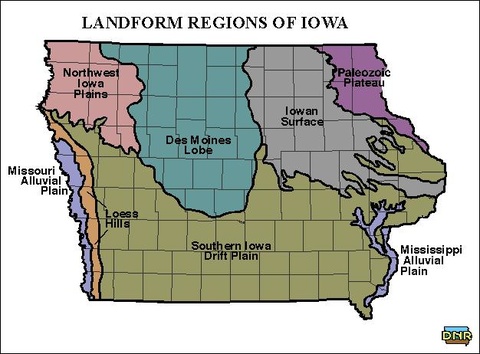
- Streams flowing through the Paleozoic Plateau of NE Iowa. This includes the Upper Iowa, Turkey, Volga, and Yellow Rivers, and Bloody Run Creek. This is the only part of Iowa that was left untouched by glaciers over the past 100 million years, and as a result, the geology and topography is unique to that area.
- Tributaries of the Missouri River. Ten rivers draining to the west and and south, all flowing through a landscape covered with windblown-Loess soil at varying thicknesses. These are probably the most disturbed rivers in Iowa.
- Iowan Surface Streams of Eastern Iowa. The Iowan surface has been glaciated, but was left uncovered during the last glacial period (Wisconsinin) that ended 10,000 years ago. Winds howling off the ice-covered Des Moines Lobe shaped this prehistoric tundra. Data from 12 streams sites in the Cedar, Wapsipinicon, and Maquoketa basins are included here.
- Des Moines River Basin Upstream of the Raccoon River confluence. Three of the four sites lie completely within the recently-glaciated Des Moines Lobe, while the fourth (South Raccoon at Redfield) is at its edge. All are highly influenced by constructed drainage (field tiles and drainage ditches).
- Des Moines River Basin Downstream of the Raccoon River confluence. This includes three Des Moines River tributaries flowing from the south through a Loess landscape, and the Des Moines River itself near its terminus.
- Iowa and Skunk River Basin sites. Water spills off the tile-dominated Des Moines Lobe to flow southeast through multiple landforms before draining to the Mississippi River. The Skunk River is likely the most point-source dominated of all Iowa streams, meaning wastewater discharges may strongly influence water quality.
In my experience, people want to know what stream water quality is now, and whether it's getting better or worse. Communicating these things can be complicated, because you need lots of data collected over a long time to make sweeping conclusions. And statements about trends are always risky because things can change fast in a radically-altered landscape like Iowa. What I did here is to say the last five years (2016-2020) is "now", and then I compared that period with the pre-2016 data to construct statements about trends.
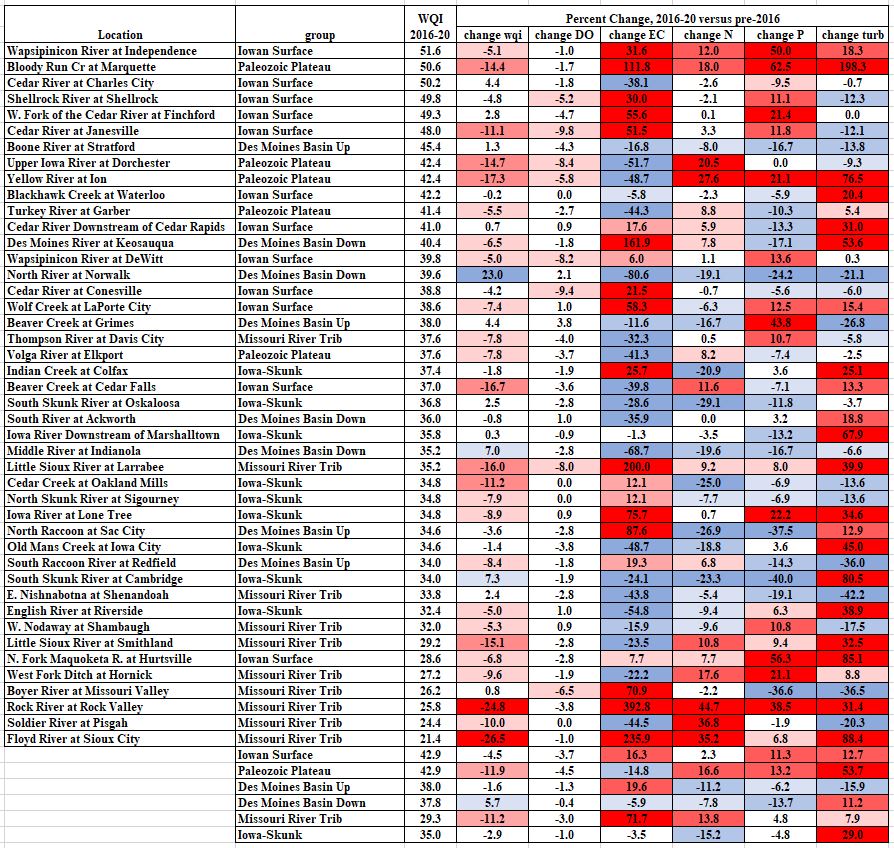
I also wanted to know which of the five measured parameters is driving changes in the WQI at the various sites. So I included that
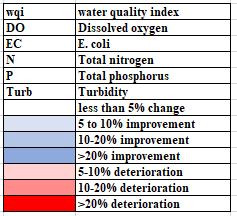
information, along with the WQI values in the table below. Red is getting worse, blue is getting better, white is not changing very much. I should emphasize that average values for the five parameters do not drive the WQI value. Rather, the WQI is based on whether a set threshold is exceeded, and by how much. Please refer to the earlier blog post for more details.
I'm not sure how the big table will look on your phone if you're accustomed to reading these posts there. Here is a link to the table if you want to look at it in a separate window.
Narrative continues below the table.


Here are some of my conclusions:
- Only 3 out of the 44 stream sites are noticeably better over the past five years, when compared to the 2000-2016 period.
- 27 sites are noticeably worse.
- The North River at Norwalk is improving dramatically. Nutrients, E. coli, and turbidity have all improved a lot. This is also one of the few sites where dissolved oxygen has improved. I don't have an explanation for why this stream is getting better. Urban areas are expanding in the lower part of the watershed, but the basin is still largely rural and agricultural. It's interesting that the adjacent Middle River watershed to the south is also improving. This is probably not a coincidence.
- Streams draining to the Missouri River are terrible and getting worse. This is especially true of the Rock and Floyd Rivers. At this point, anybody still clinging to the narrative that high-density livestock areas don't disproportionately degrade our water is truth-challenged, to put it generously. (Technically, the Rock River flows to the Big Sioux River, which drains to the Missouri). While acknowledging the statewide reduction goals associated with the Iowa Nutrient Reduction Strategy, I have to wonder about the wisdom of spending taxpayer dollars on watershed improvement in this region, at least until there are fundamental changes associated with Iowa's livestock industry. And this includes our Master Matrix regulation that governs construction permits and manure application. With the possible exceptions of the Thompson and upper Little Sioux Rivers, these streams really look like lost causes to me.
- What is happening to NE Iowa streams is very worrisome. In aggregate, streams of the Paleozoic Plateau, which are some of our very best, are degrading faster than Missouri River tributaries. I think there's reason to panic about Driftless area streams. Although nutrient levels are increasing, turbidity (clarity) trends are especially disconcerting. Streams can maintain some biological integrity with elevated nutrient concentrations. But aquatic life assemblages accustomed to a clear water condition, like that in NE Iowa, will not endure very long in muddy water.
- Turbidity (clarity) seems to be getting worse except on the Des Moines Lobe. There were significant improvements in stream clarity in Iowa following 1985 Farm Bill, which established the Conservation Compliance rule. This required farmers of Highly Erodible Land (HEL) to adopt soil conservation practices if they wanted to benefit from the federal farm programs. There seems to be some retreat from those improvements over the last five years, with 5 of my 6 groups seeing an increase in turbidity.
- Geese are not driving stream E. coli, despite what some would have you believe. Our state's prime habitat for Sus scrofa domesticus, the Rock and Floyd River watersheds, saw E. coli increases of +393% +236%, respectively.

Sus scrofa domesticus - Claims about declining stream phosphorus are suspect. I know some people believe phosphorus levels are declining based on modeled outcomes of practice implementation, but I (and some others) just do not see it in the water quality data. Because phosphorus attaches very tenaciously to soil particles, trends in turbidity should align with trends in phosphorus; however in these data, sometimes they do, and sometimes they don't. I don't have a good explanation for the inconsistency.
Water quality in our streams and lakes will not improve until the public demands it.