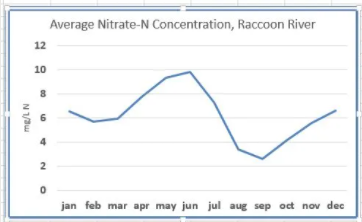
Nitrate levels in Iowa streams ebb and flow with the calendar and the weather. In an average year, concentrations follow an “S” curve, therefore highest in the spring and early summer, low in late summer in early fall, higher in the winter, and then low again in late winter-early spring (figure at right). This S curve rides atop longer-term trends that may last a couple of years or more.
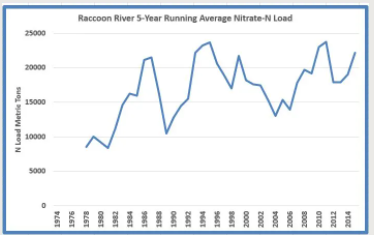
One way to look at these longer trends is to calculate a “running average” that distills data from defined period into one measurement. A 5-year running average is calculated every year, from the previous five years’ values. The bottom figure is an example showing 5-year running average Raccoon River nitrate loads. We can see the ebb and flow seems to follow 10-12 year cycles. The best explanation for this is probably climate, but we aren’t sure.
I am pretty sure that the Raccoon is ending a streak of very high nitrate levels that began in June of 2014. The average concentration since that time has been 13.9 mg/L. This is more than double the long term average since 1974 (6.44 mg/L). The monthly maximum concentration at Des Moines has exceeded the drinking water standard of 10 mg/L every month since September of 2014, a period of 22 consecutive months. The previous longest such streak I can find in the record is 20 months (2002-2003).
I think the streak is coming to an end because nitrate levels have dropped significantly the last few weeks and are now about 7.5 mg/L. The crops are maturing and using a tremendous amount of water and nitrogen. Persistent dryness has reduced tile flow. Weather next week looks very hot and mostly dry. I think it will take a dramatic change in the recent weather regime to return nitrate to the levels seen over the past two years.