It is really tempting to talk about water quality trends. Sometimes the direction water quality is going (i.e. better, worse, or the same) seems more important to the discussion than the current condition itself. Certainly any degradation of a very high quality stream or lake is cause for concern. Unfortunately, this is not something we worry about much, simply because we don’t have many water resources in Iowa that are of a very high quality. On the other hand, we are keenly interested if whether or not poor or average water quality is improving. We want to know if conservation practices, watershed improvement projects, and improvement plans are paying off.
Determining trends is tricky business. You’re looking into the past at water quality data to see if you can discern what has happened. Then you try to see if these changes correlate with something else: local, state, and federal policy; land use changes; advances in technology. The problem we have with this approach here in Iowa is that year-to-year weather variations are large, some would say extreme. The yo-yo effect of weather makes linking water quality changes to our own actions and decisions difficult. This is especially true for nitrate.
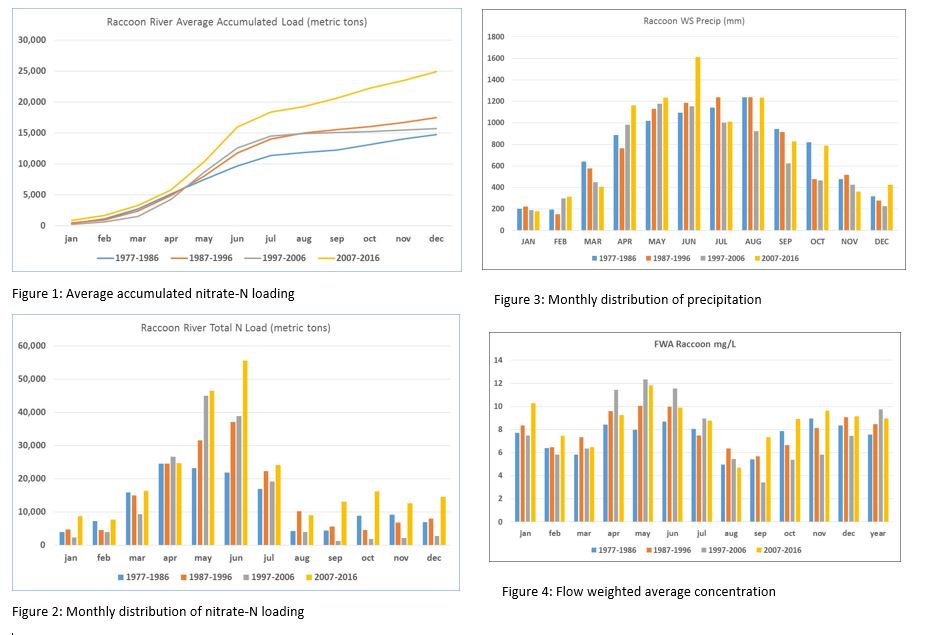
We know for a certainty that stream nitrate levels have increased by about a factor of six since 1900, increasing from a statewide average of 1 mg/L or less to about 6-8 mg/L in the present day. As we look back to the mid 1970s, when the modern system of agriculture was becoming entrenched, determining trends becomes more risky. Most people that study these things think that there probably have not been huge changes in stream nitrate since the mid-1980s. However, if we look at the Racooon River of central and western Iowa, the last 10 years have seen some very high nitrate loads (the total mass transported by the stream). Figures 1 and 2 below illustrate this.
Is this a trend?
Most reasonable people would say yes. When we look at precipitation (Figure 3) it is clear the last 10 years have been very wet. The period from 2007-2010 was the wettest four-year period for the watershed ever, dating back to the 1890s. When we have a system like ours that is saturated with a water-soluble pollutant like nitrate, it stands to reason that more water will carry more nitrate. Figure 4 in the lower right shows flow-weighted average nitrate concentrations. This is the amount of nitrate per unit of water (mg/L) accounting for flow differences. Essentially it is total load divided by total flow for a defined period. The last 10 years look pretty similar to the previous 10 years. So do we still have a trend?
What these graphs really show is a weather trend toward rainier conditions. It’s likely not much has changed on the landscape over the last 20-30 years in the context of the amount of nitrogen available for loss to streams. Rather we have more water to move more nitrate to our streams. Something to consider when creating strategies for water quality improvement.