Blog Posts
This is what happened
Tuesday, February 12, 2019
History of Iowa agriculture in the context of nitrogen pollution
Report on Boone R. Nitrate for Nature Conservancy
Thursday, November 8, 2018
The Boone River Report can be found here.
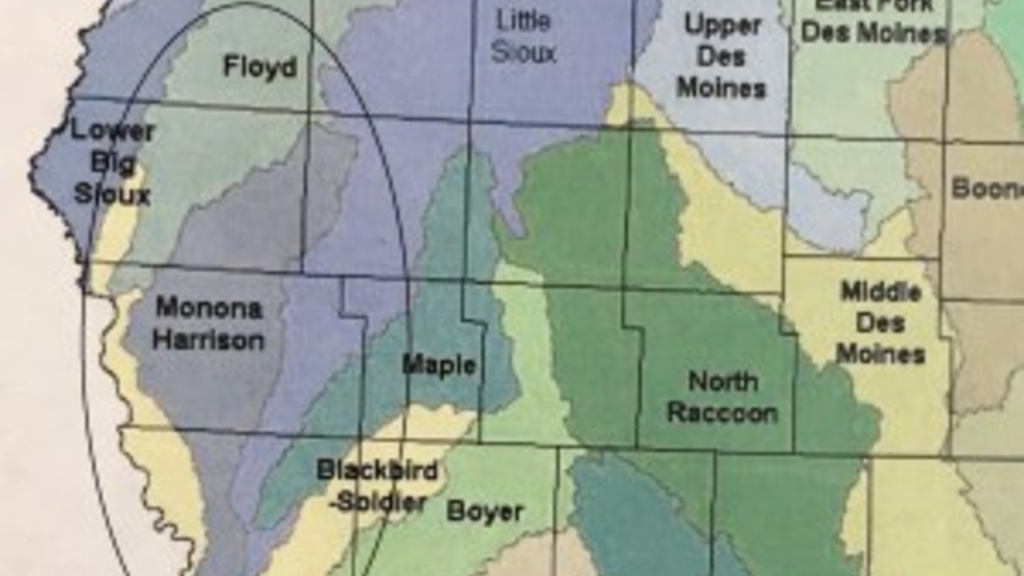
Monona-Harrison Ditch Watershed
Monday, September 10, 2018
Nitrate Concentration of the Monona-Harrison Ditch Watershed in 2017.
East Nishnabotna Watershed: 2017 nitrate
Friday, July 27, 2018
Nitrate concentration of the East Nishnabotna River in 2017.
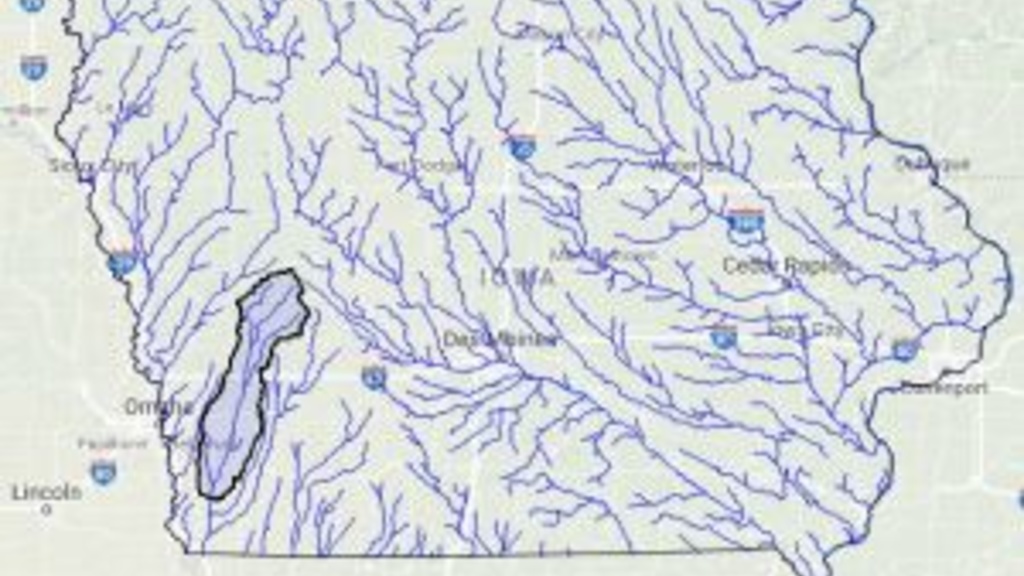
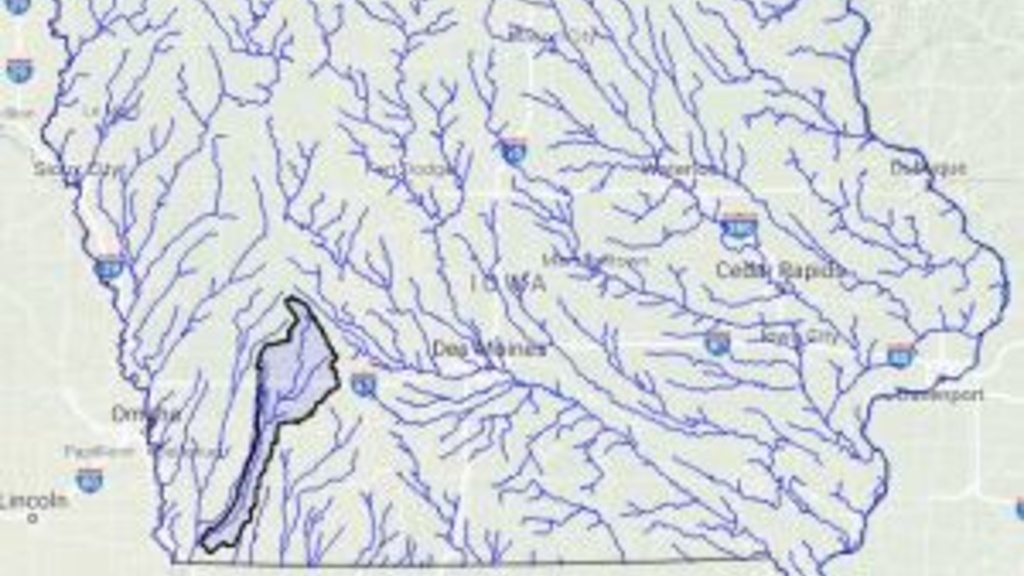
West Nishnabotna River Watershed: 2017 Nitrate
Thursday, July 26, 2018
Nitrate concentrations of the Nishnabotna River in 2017.
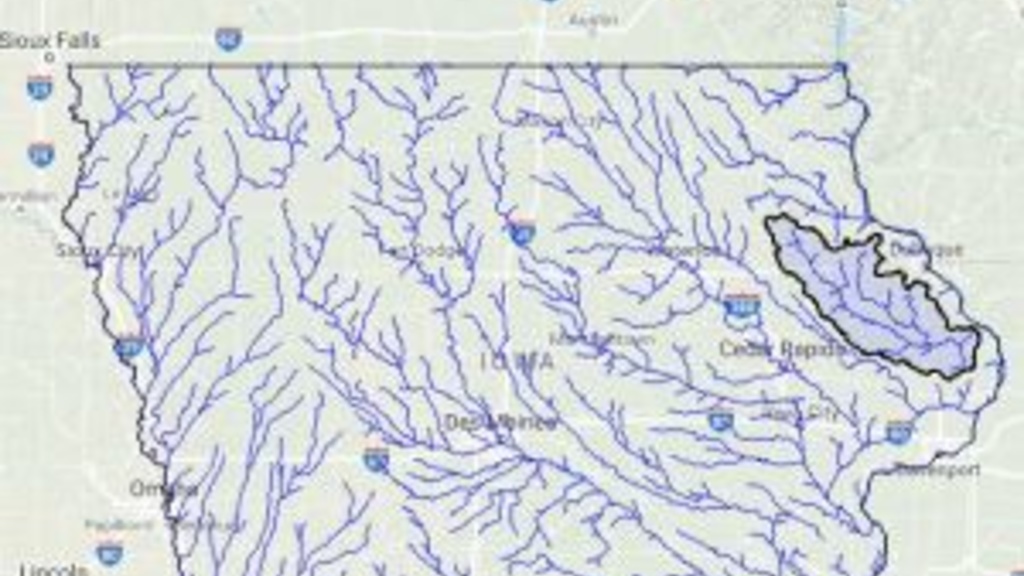
2017 Nitrate: Maquoketa River
Tuesday, July 17, 2018
Nitrate concentrations of the Maquoketa River in 2017.

2017 Nitrate: Wapsipinicon River
Wednesday, July 11, 2018
Nitrate concentrations of the Wapsipinicon River in 2017.
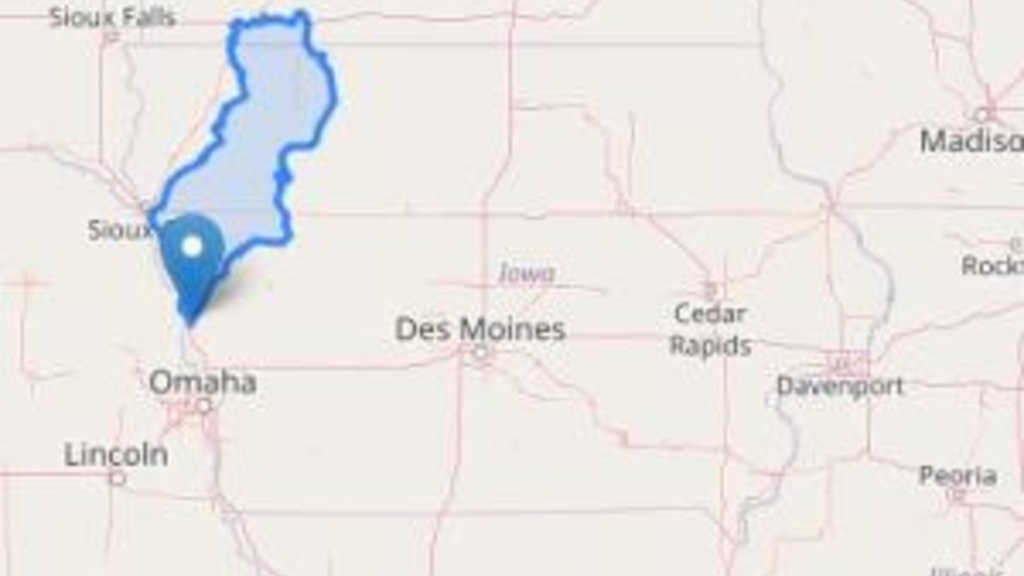
2017 Nitrate: Little Sioux River
Tuesday, July 10, 2018
Nitrate concentrations of the Little Sioux River in 2017.
Tale of Two Raccoons
Monday, July 9, 2018
I have 44 years of rock solid Raccoon River nitrate data measured at Fleur Drive in Des Moines, courtesy of Des Moines Water Works. In looking at historical water quality data, it is interesting and fun to divide your record into pieces. 44/2 = 22, so let’s do that.
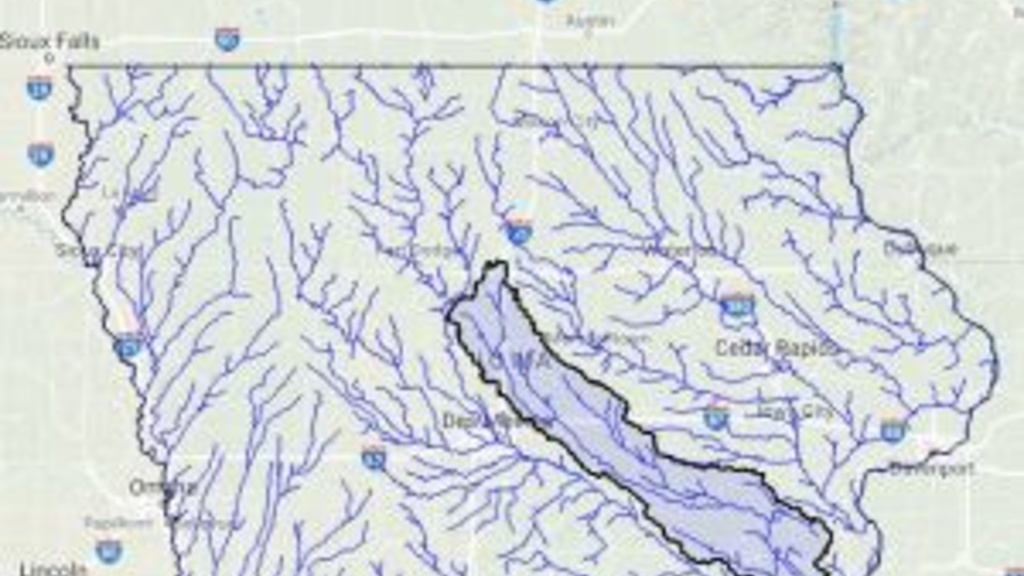
2017 Nitrate: Skunk River at Augusta
Monday, July 9, 2018
Nitrate concentrations on the Skunk River at Augusta in 2017.