Blog Posts
Cedar River Hydrograph-Nitragraph animation
Thursday, October 27, 2016
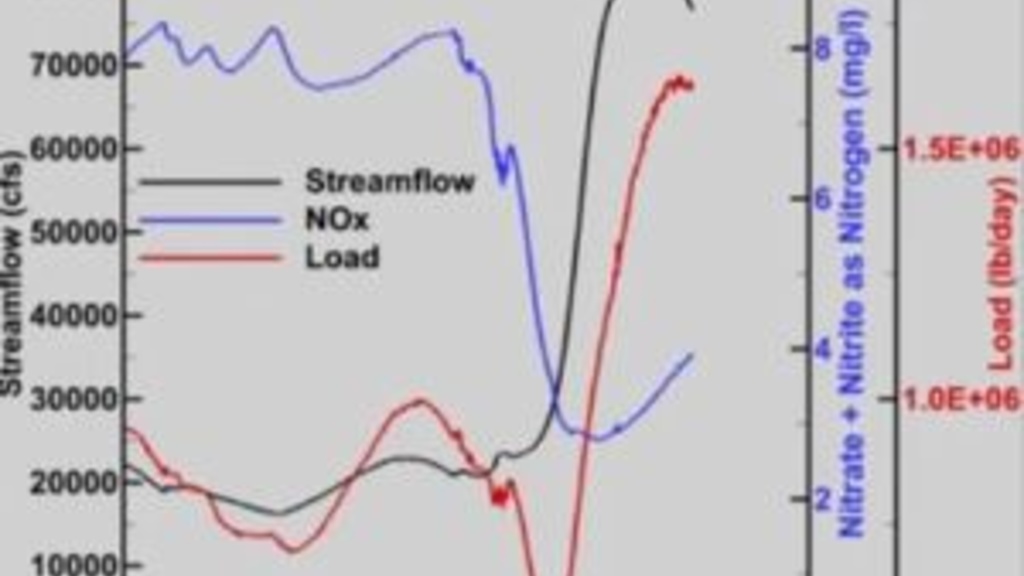
My last post discussed how Cedar River nitrate loading responded to flood of late September. This post builds on that with some excellent animations created by my colleague, Antonio Arenas.
Nitrate Loads Associated with Cedar River Flood
Tuesday, October 11, 2016
The flood of 2008 delivered a lot of nitrate-nitrogen to the stream network, where it then reaches the Mississippi River and eventually the Gulf of Mexico. Elevated nutrients in the Gulf cause hypoxia, an area of depleted dissolved oxygen where fish and other ocean life cannot survive.

Plate of the Union Water Quality Panel Discussion
Tuesday, October 11, 2016
In 2016, the Iowa State University Sustainable Agriculture Student Association (SASA) received a national grant from the Plate of the Union Campus Challenge. Part of this sponsorship included hosting a panel on water quality issues.
Groundwater Nitrate Monitoring
Friday, October 7, 2016
Most of the Iowa Water Quality Information System network is devoted to stream sampling. However, two sensors have been measuring nitrate in groundwater springs at the Iowa DNR Big Spring and Manchester fish hatcheries for the past year. Conclusion: nitrate in northeast Iowa groundwater is really high.
September and Year-to-Date nitrate, Raccoon and Des Moines Rivers
Wednesday, October 5, 2016
September 2016 was the biggest N loading month of September ever for the Des Moines River. There has been a lot of fall loading on both rivers the last 2-3 years.
August and Year-to-Date Nitrate for Raccoon and Des Moines Rivers
Tuesday, September 13, 2016
The graphs illustrate nitrate-N in the Raccoon and Des Moines Rivers (at Des Moines). Each graph is duplicated; in the first, the data is sorted by magnitude, in the second, the data is sorted chronologically.

Vulnerability
Tuesday, August 30, 2016
Data showing the inputs and outputs of nitrogen in a watershed in 2015. N can be added or taken from a watershed in various ways, though some of them can be difficult to measure.
Raccoon River Watershed, 2015 vs. 2016
Thursday, August 18, 2016
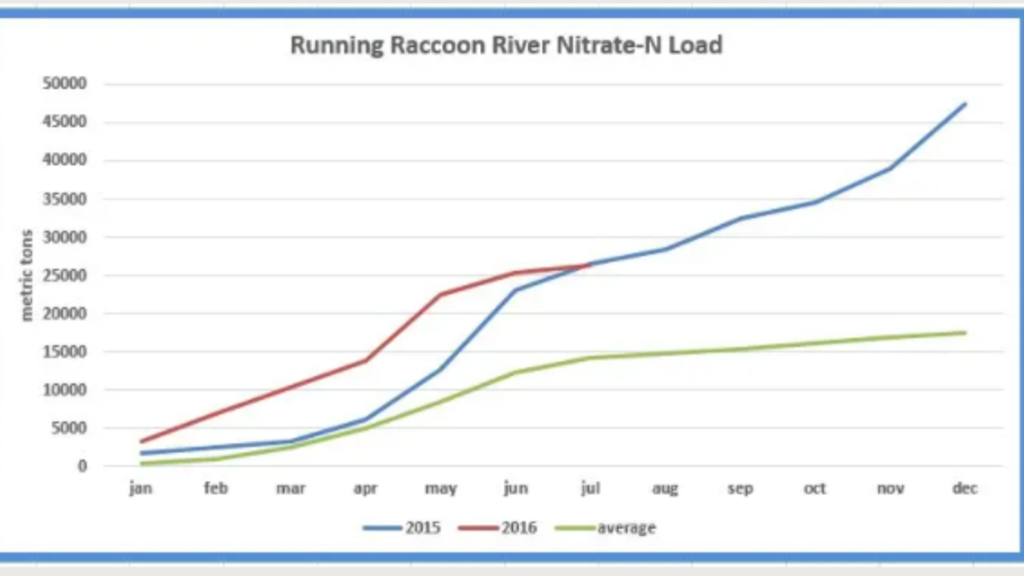
How do precipitation and nitrate load accumulate through the calendar year in the Raccoon River Watershed?
Raccoon and Des Moines Rivers: 2016 Nitrate, July Update
Tuesday, August 9, 2016
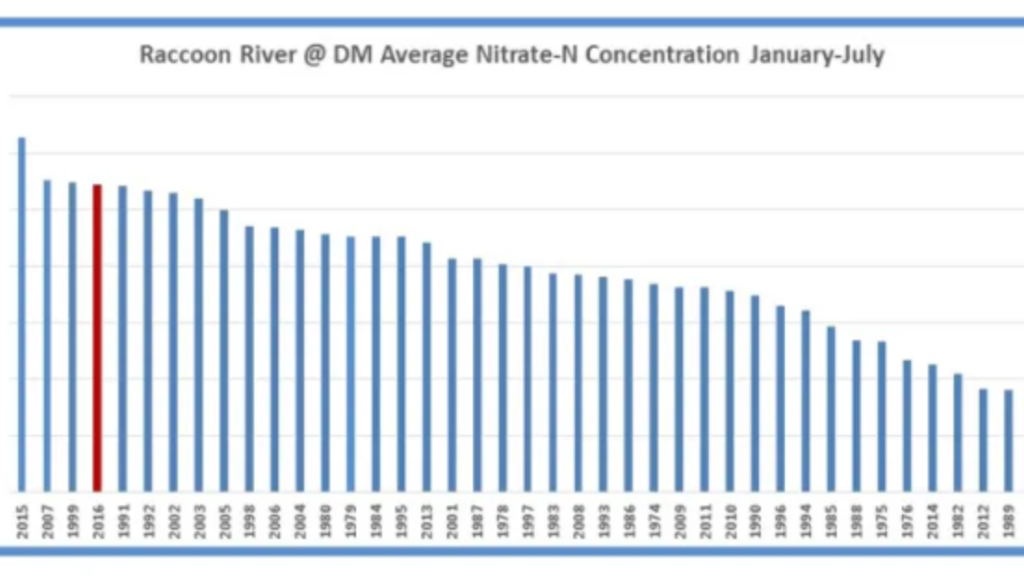
How do current nitrate data for the Des Moines and Raccoon rivers compare to past years?
Does Federal Farm Conservation Spending Work?
Friday, July 29, 2016
More than $500 per every U.S. citizen that has lived since 1937 has been spent trying arrest soil erosion. Did it work?